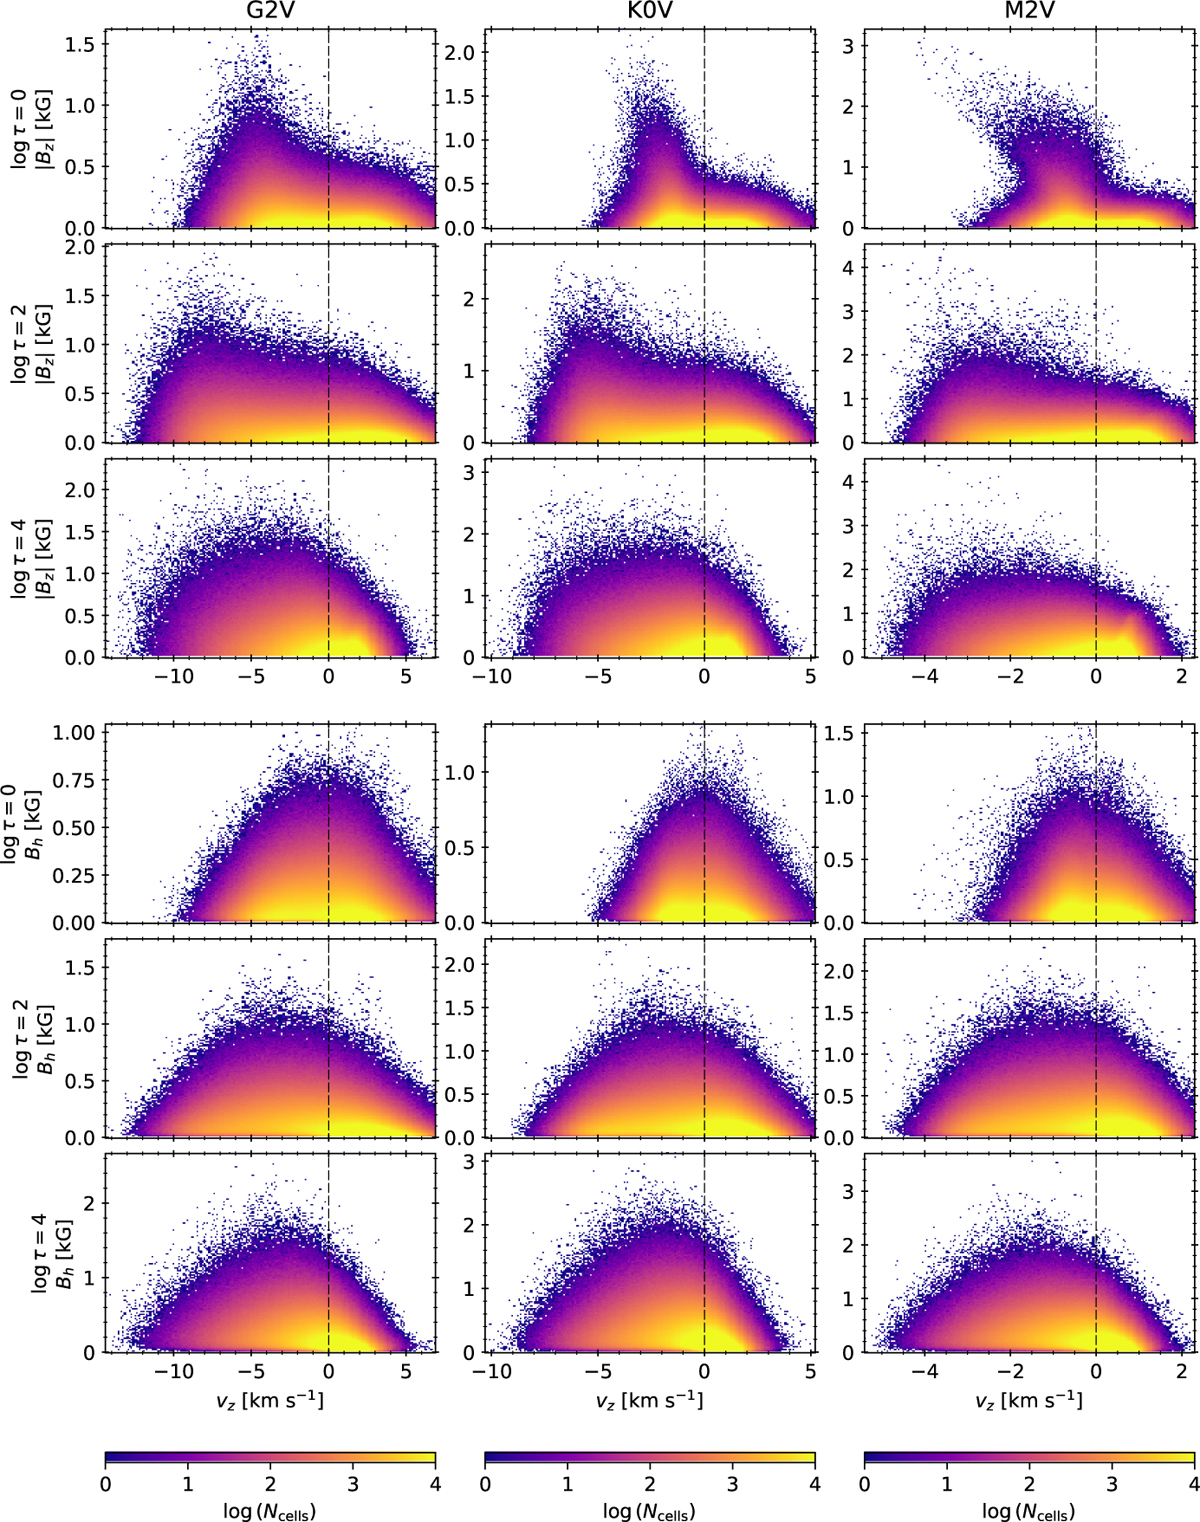
Fig. B.1
Download original image
Logarithm of number of domain cells Ncells (colour maps) in terms of magnetic field components |Bz| (three top rows) and Bh (three bottom rows) and vertical velocity υz in all snapshots from the SSD run of the time series of the G2V (left column), K0V (middle), and M2V (right) star. Each row shows the number of cells for a different optical depth (log τ = 0, 2, 4), indicated next to the y-axis labels at the left.
Current usage metrics show cumulative count of Article Views (full-text article views including HTML views, PDF and ePub downloads, according to the available data) and Abstracts Views on Vision4Press platform.
Data correspond to usage on the plateform after 2015. The current usage metrics is available 48-96 hours after online publication and is updated daily on week days.
Initial download of the metrics may take a while.