Fig. 5
Download original image
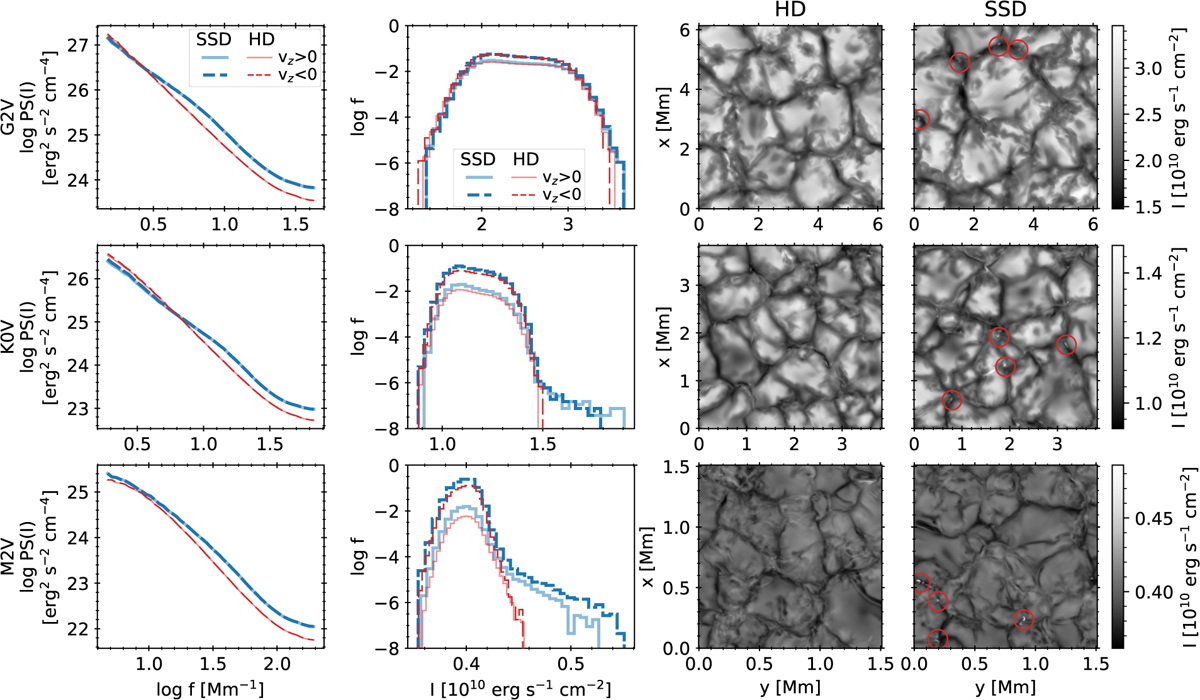
Logarithm of power spectrum, normalised histogram, and colour maps of the vertical outward bolometric intensity I at the top of the atmosphere for the G2V (top row), K0V (middle), and M2V (bottom) stars. Left column: logarithm of the time averaged radial spatial power spectrum of the intensity versus the logarithm of the radial spatial frequency f. Second column: Logarithm of the relative frequency f of the normalised histogram of the intensity for the complete time series. In both the left and second columns, dark solid and light dashed lines indicate upflos and downflows, respectively; blue thick and red thin lines indicate SSD and HD runs, respectively. Third and right columns: colour maps of the intensity of the last snapshot of the HD (third column) and SSD (right) time series. Red circles show the location of magnetic bright points produced by flux concentrations (see Fig. 6).
Current usage metrics show cumulative count of Article Views (full-text article views including HTML views, PDF and ePub downloads, according to the available data) and Abstracts Views on Vision4Press platform.
Data correspond to usage on the plateform after 2015. The current usage metrics is available 48-96 hours after online publication and is updated daily on week days.
Initial download of the metrics may take a while.