Open Access
Fig. 7.
Download original image
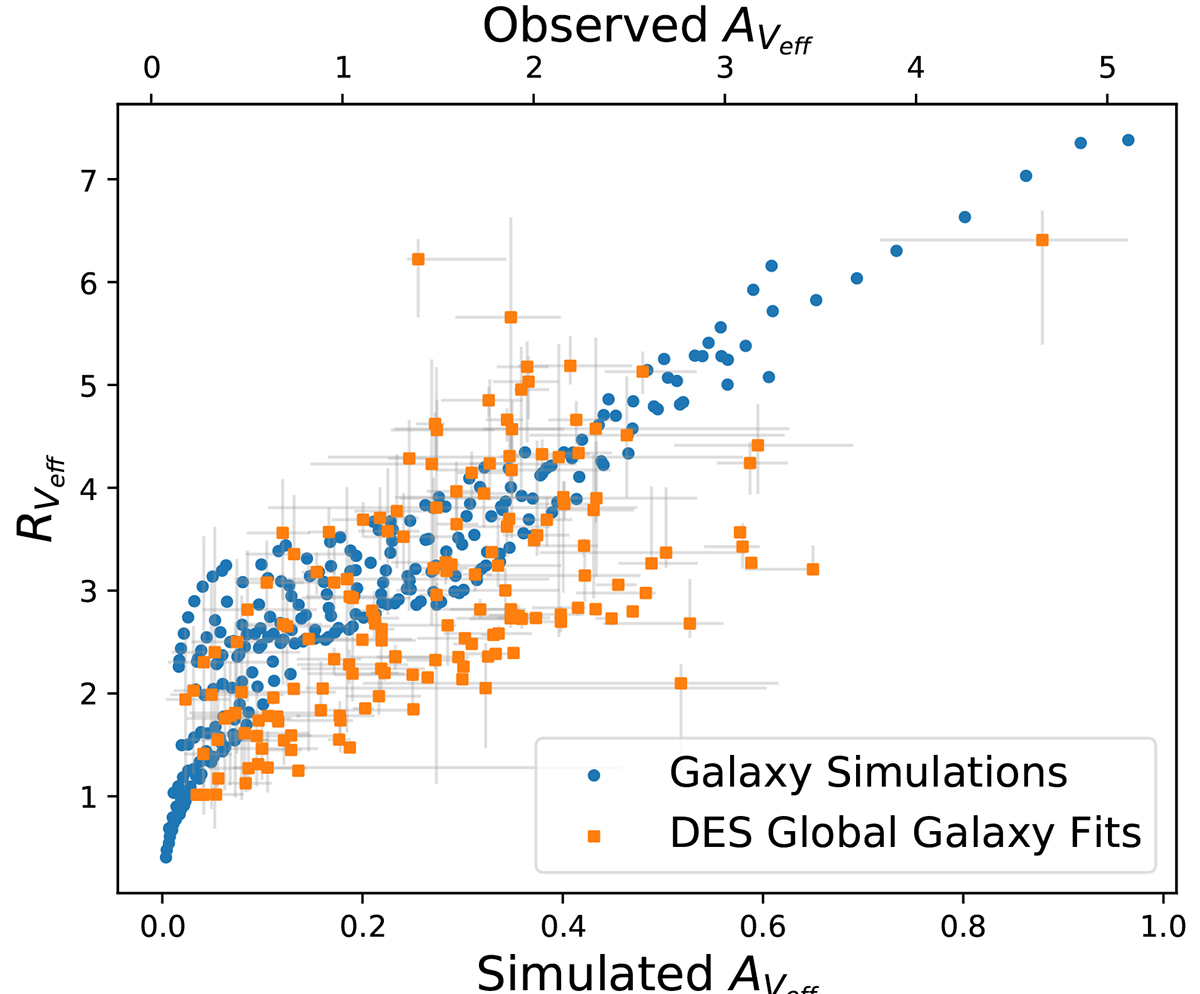
Values of RVeff as a function of AVeff for the simulated galaxies presented in Fig. 6 (blue circles, lower axis) and DES global galaxy fits from Duarte et al. (2023) (orange squares, upper axis). The plot illustrates the same general trend, even though the AVeff values are not compatible.
Current usage metrics show cumulative count of Article Views (full-text article views including HTML views, PDF and ePub downloads, according to the available data) and Abstracts Views on Vision4Press platform.
Data correspond to usage on the plateform after 2015. The current usage metrics is available 48-96 hours after online publication and is updated daily on week days.
Initial download of the metrics may take a while.