Fig. 11
Download original image
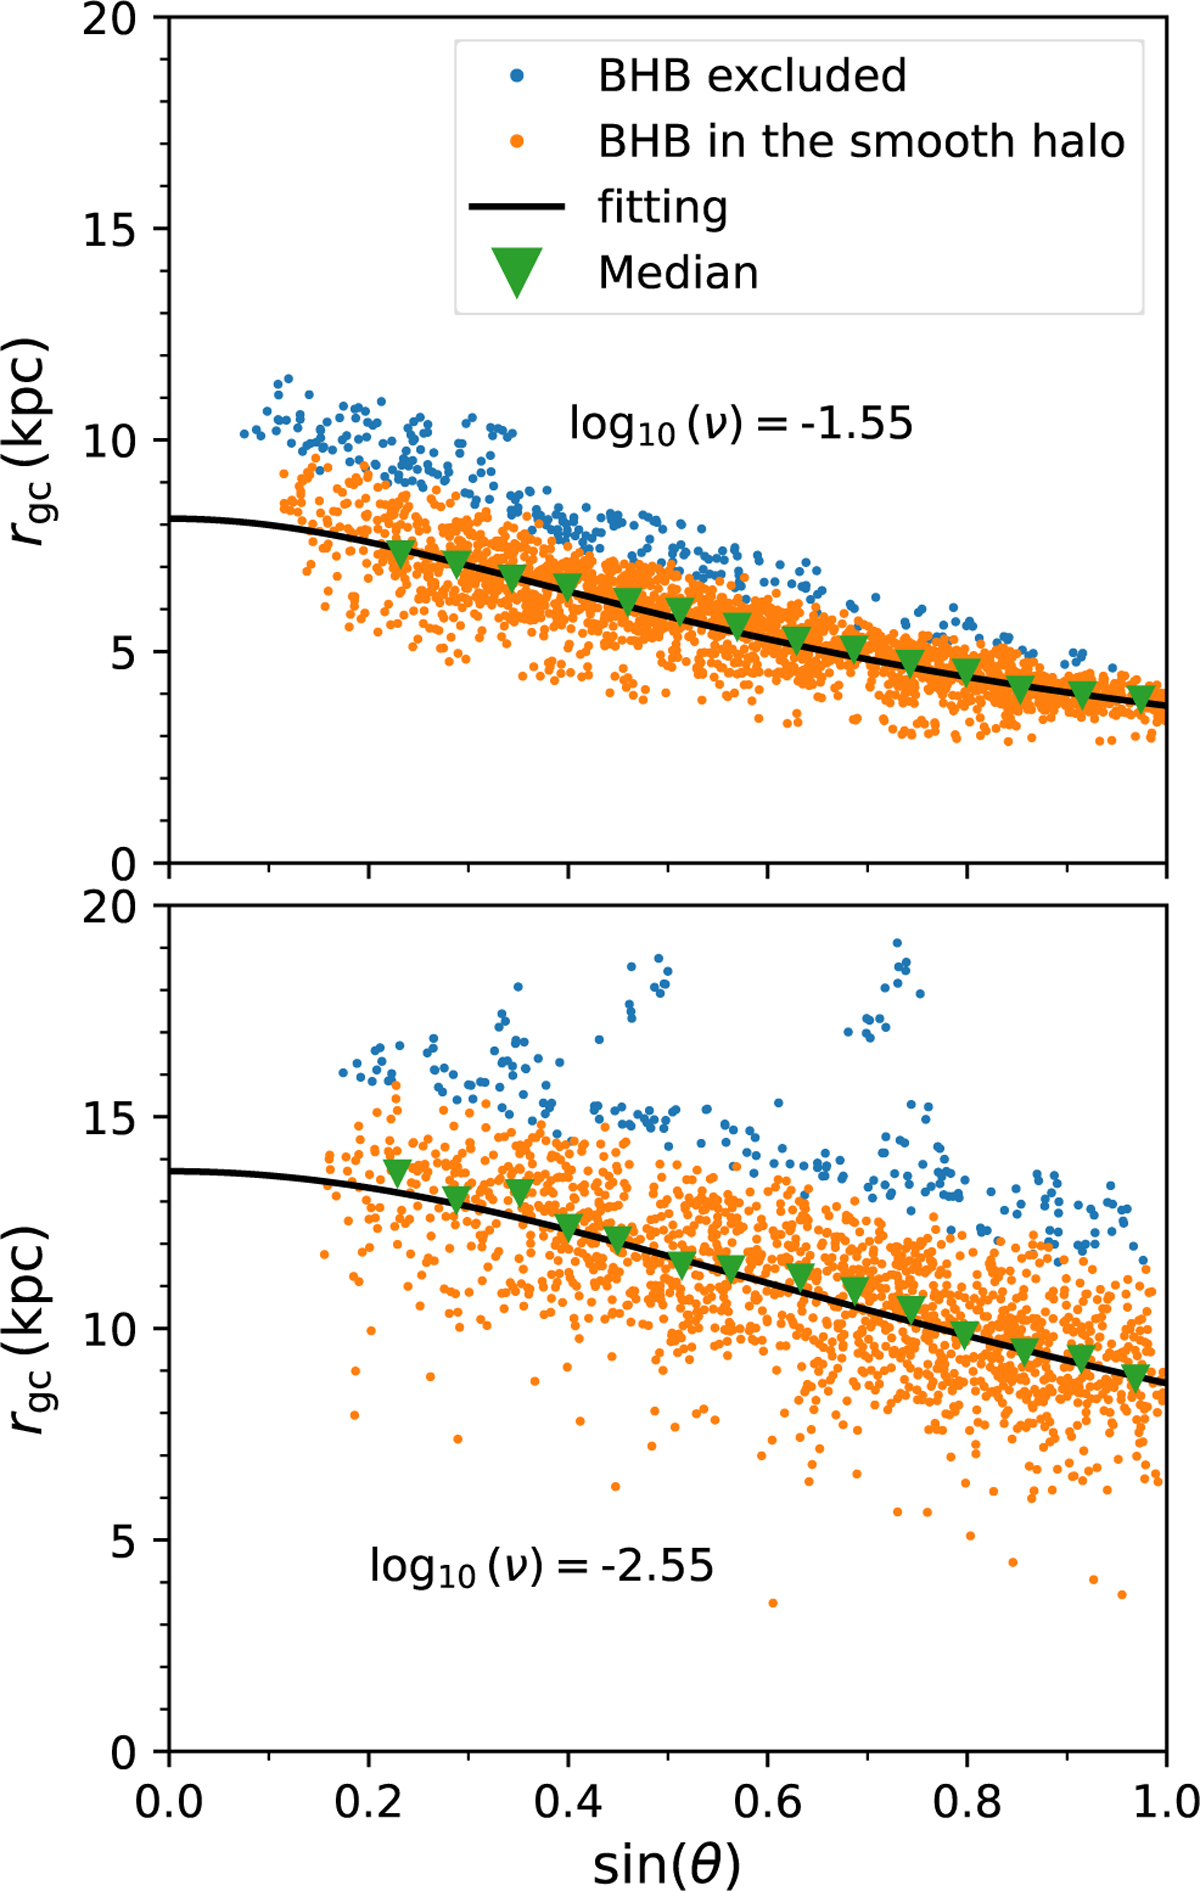
Fitting results in two bins of log10(ν) = −1.55 (top panel) and −2.55 (bottom panel) for the BHB subsample of the smooth halo. In each panel, the orange points are BHB stars within the specified bin, while the green inverted triangles indicate the median value of rgc. The black lines depict the best fitting results of the subsample. The blue points denote stars that were previously included in Figure 8 but have been excluded here due to their large residual of ![]() ≥ 0.6. In the top panel, the excluded BHB stars are responsible for the prominent overdensity in the solar neighborhood in Figure 7. In the bottom panel, these excluded stars are likely associated with the overdensity in the outer regions of the halo.
≥ 0.6. In the top panel, the excluded BHB stars are responsible for the prominent overdensity in the solar neighborhood in Figure 7. In the bottom panel, these excluded stars are likely associated with the overdensity in the outer regions of the halo.
Current usage metrics show cumulative count of Article Views (full-text article views including HTML views, PDF and ePub downloads, according to the available data) and Abstracts Views on Vision4Press platform.
Data correspond to usage on the plateform after 2015. The current usage metrics is available 48-96 hours after online publication and is updated daily on week days.
Initial download of the metrics may take a while.