Fig. 9
Download original image
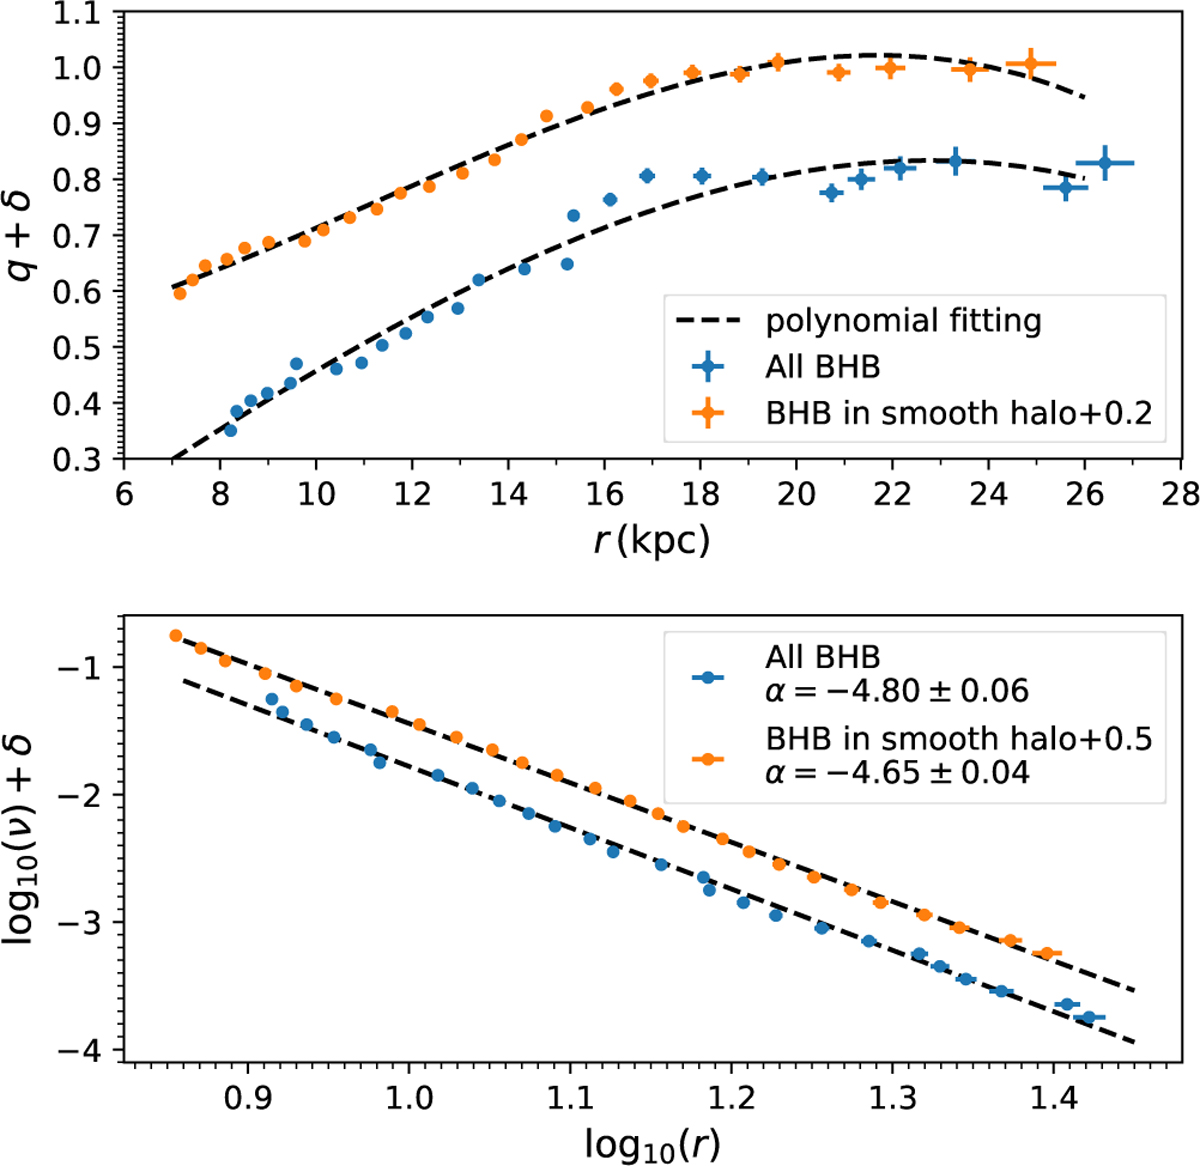
Density shape and profile of the stellar halo traced by the BHB sample. The top panel shows the variation in q with increasing r for all BHB stars (blue points) and the subsample (orange points). To better distinguish the results of the two samples, a constant of 0.2 is added to q of the subsample. The stellar halo is largely vertically flattened in the inner part and transformed into a nearly spherical shape at the outer radii. The bottom panel shows the relationship between the radial stellar density log(ν) and the flattened radius r. Assuming a variable flattening, the radial density profile of the stellar halo derived from all BHB stars (blue points) can be well described by a SPL with an index α = −4.80 ± 0.06, and for the subsample (orange points, a constant of 0.5 is added to log(ν)) the best result is α = −4.65 ± 0.04.
Current usage metrics show cumulative count of Article Views (full-text article views including HTML views, PDF and ePub downloads, according to the available data) and Abstracts Views on Vision4Press platform.
Data correspond to usage on the plateform after 2015. The current usage metrics is available 48-96 hours after online publication and is updated daily on week days.
Initial download of the metrics may take a while.