Fig. 1
Download original image
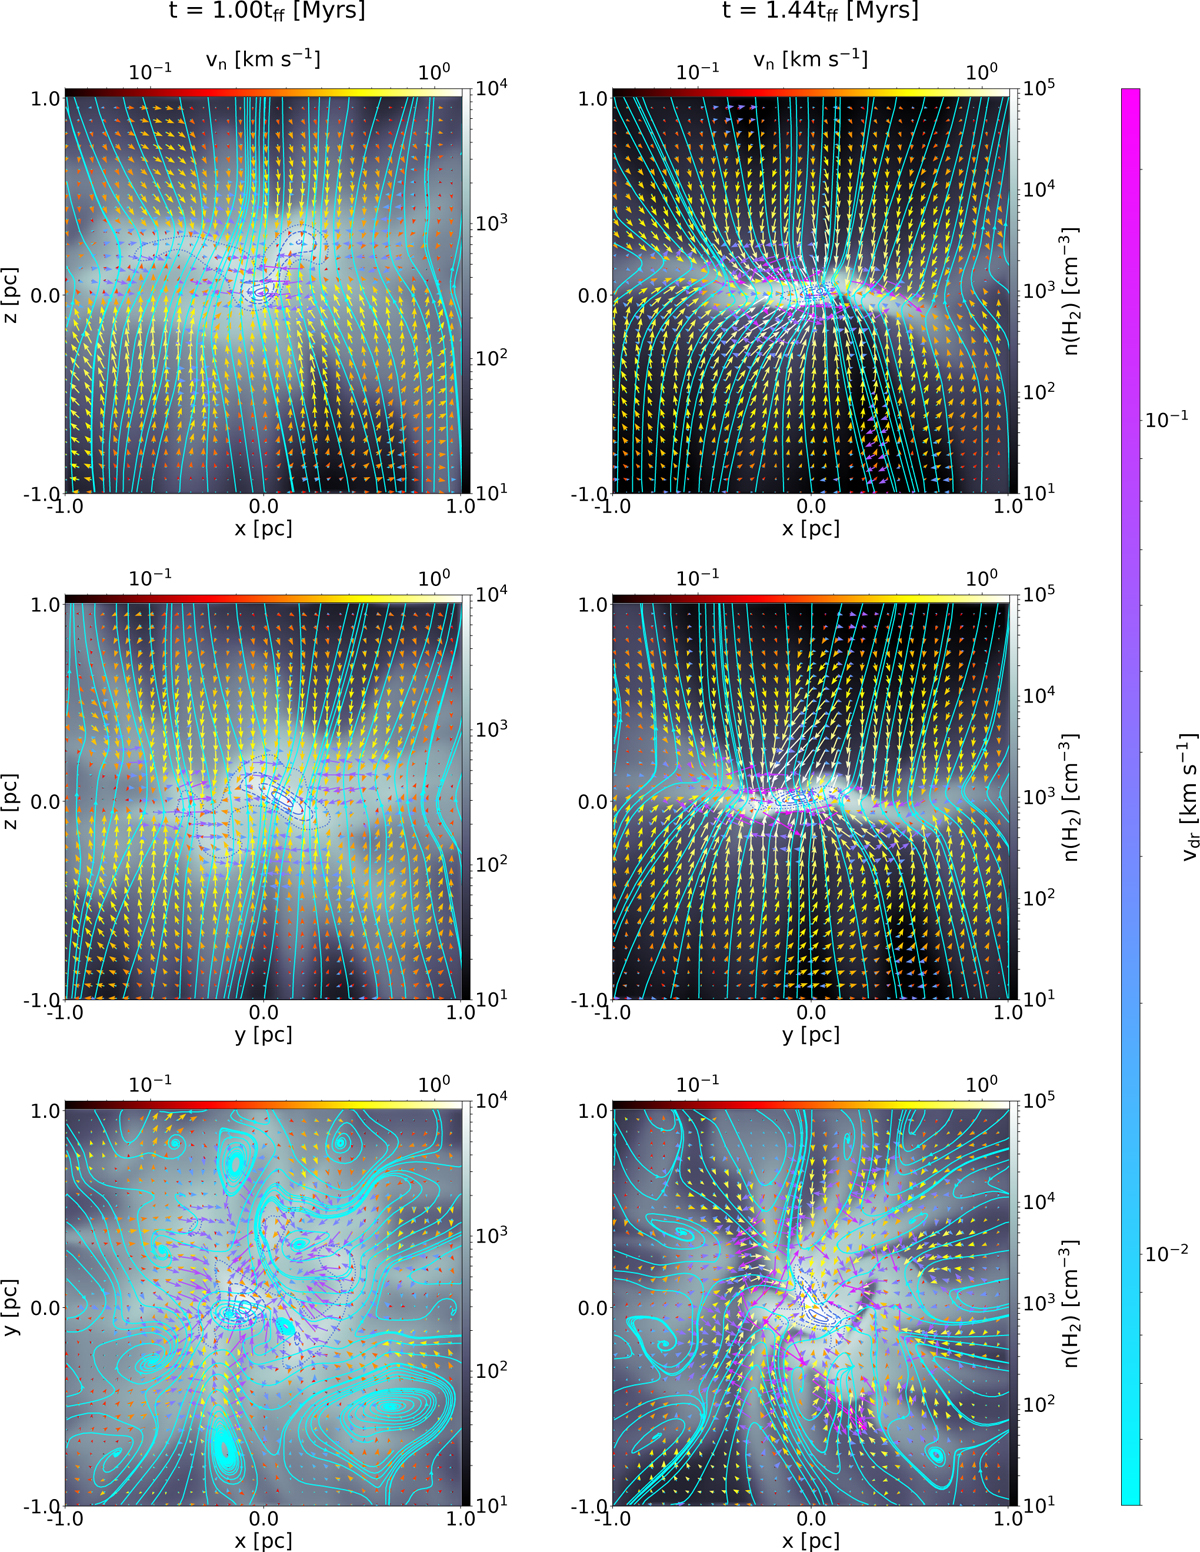
Density slices (black-white color map) through our computational cube at the location of the maximum density at one free-fall time (left column) and at the end of our simulation (right column). From top to bottom we show slices through the y, x, and z directions. Cyan streamlines show the morphology of the magnetic field in each slice and blue contours mark the density with dotted, dashed, dash-dotted and solid lines marking, respectively, the 30, 50, 70, and 90% of the maximum density. The red-yellow color map in each panel and respective arrows show the velocity of the neutrals in the simulation and the cyan-fuchsia color map and respective arrows show the neutral-ion drift velocity.
Current usage metrics show cumulative count of Article Views (full-text article views including HTML views, PDF and ePub downloads, according to the available data) and Abstracts Views on Vision4Press platform.
Data correspond to usage on the plateform after 2015. The current usage metrics is available 48-96 hours after online publication and is updated daily on week days.
Initial download of the metrics may take a while.