Fig. 2
Download original image
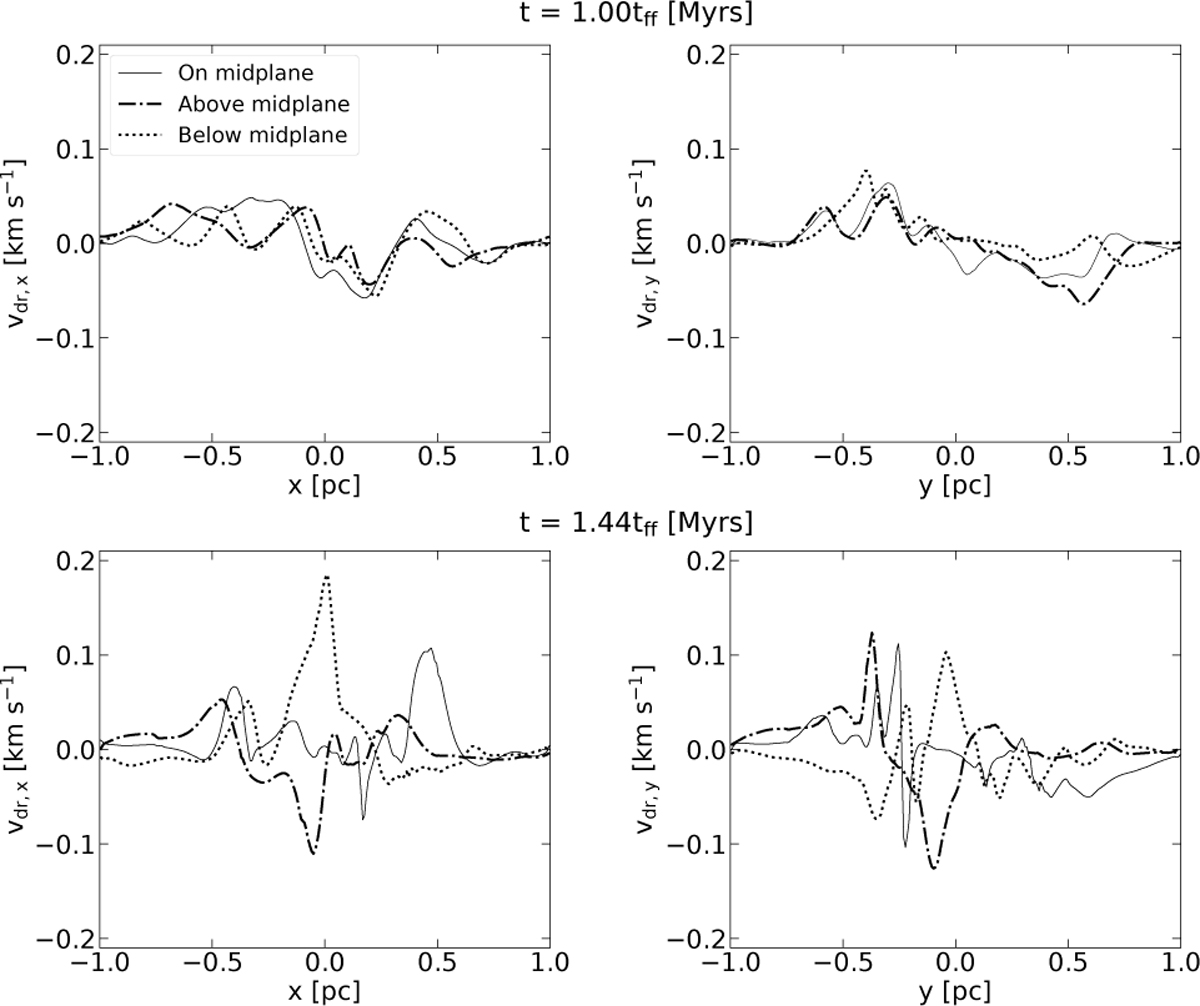
One-dimensional profiles of the x and y components of the neutral-ion drift (left and right panels, respectively) for two different times during the evolution of the cloud. In the upper row, we present our results for one free-fall time and in the bottom row we show our results at the end of the simulation. With the thin solid lines, we show the 1D profiles on the midplane of the cloud (i.e., z ≈ 0), and with the dash dotted and dotted lines we show the profiles above and below the midplane. Notice the approximate anticorrelation of the profiles above and below the midplane at the end of simulation.
Current usage metrics show cumulative count of Article Views (full-text article views including HTML views, PDF and ePub downloads, according to the available data) and Abstracts Views on Vision4Press platform.
Data correspond to usage on the plateform after 2015. The current usage metrics is available 48-96 hours after online publication and is updated daily on week days.
Initial download of the metrics may take a while.