Fig. 4
Download original image
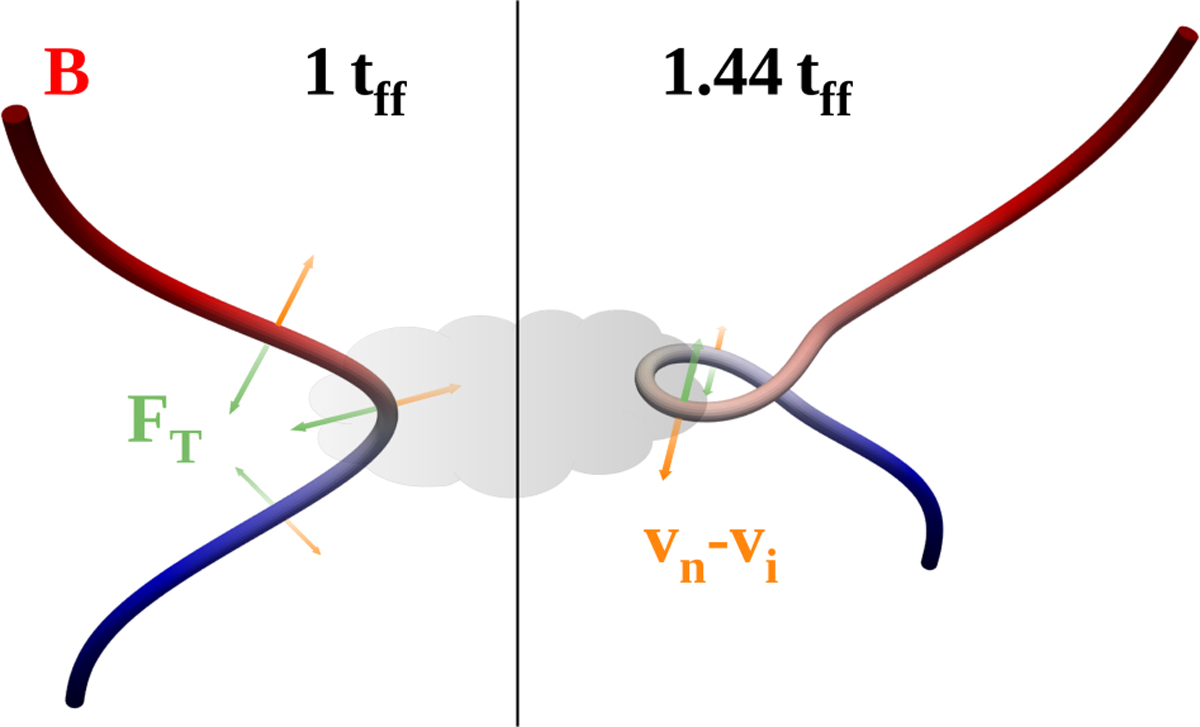
Illustration of the physical picture that explains (to zeroth order) the features seen in the drift velocity in Fig. 1 at two different times during the evolution of the cloud. Color-coded tubes represent magnetic field lines, green arrows show the direction of the magnetic tension force per unit volume, and orange arrows show the direction of the neutralion drift velocity. On the left side of the plot we depict the situation at one free-fall time, when magnetic-field lines have approximately an hourglass morphology. The right side of the plot shows the evolved magnetic-field morphology (at 1.44 tff), which explains the anticorre-lation seen in the neutral-ion drift velocity with respect to the midplane of the cloud.
Current usage metrics show cumulative count of Article Views (full-text article views including HTML views, PDF and ePub downloads, according to the available data) and Abstracts Views on Vision4Press platform.
Data correspond to usage on the plateform after 2015. The current usage metrics is available 48-96 hours after online publication and is updated daily on week days.
Initial download of the metrics may take a while.