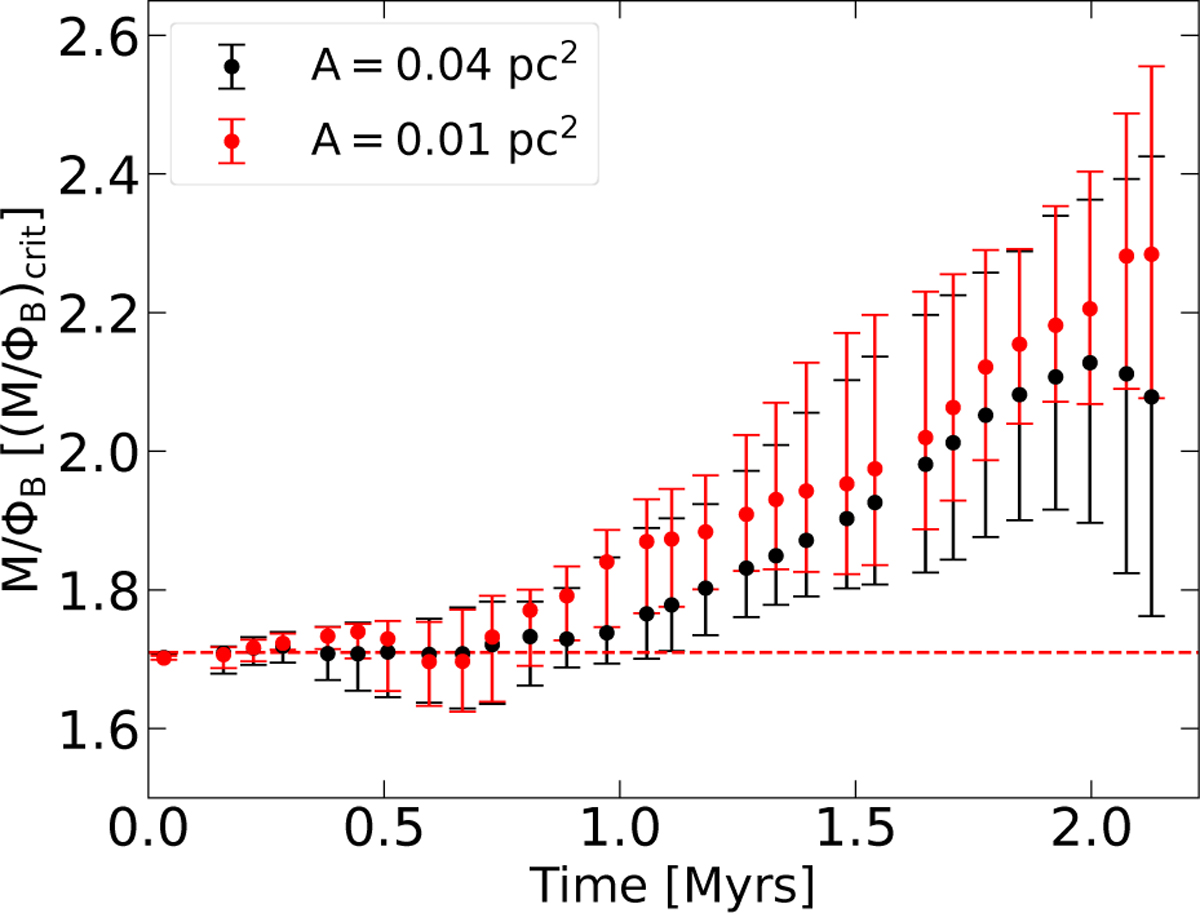
Fig. 5
Download original image
Evolution of the mass-to-flux ratio as a function of time in a slice perpendicular to the z axis, centered on the location of the maximum density at a time of 1.44 tff. The mass-to-flux ratio was computed for all cells within a 0.2×0.2 pc2 area. With the black points we show the 50th percentile from all pixels in the region and the error bars represent the 16th and 84th percentiles, respectively. With the red points we have zoomed further in to the location where the density eventually increases. The area of this region is 0.01 pc2. The dashed red line marks the initial value of the mass-to-flux ratio in the simulation.
Current usage metrics show cumulative count of Article Views (full-text article views including HTML views, PDF and ePub downloads, according to the available data) and Abstracts Views on Vision4Press platform.
Data correspond to usage on the plateform after 2015. The current usage metrics is available 48-96 hours after online publication and is updated daily on week days.
Initial download of the metrics may take a while.