Fig. B.1
Download original image
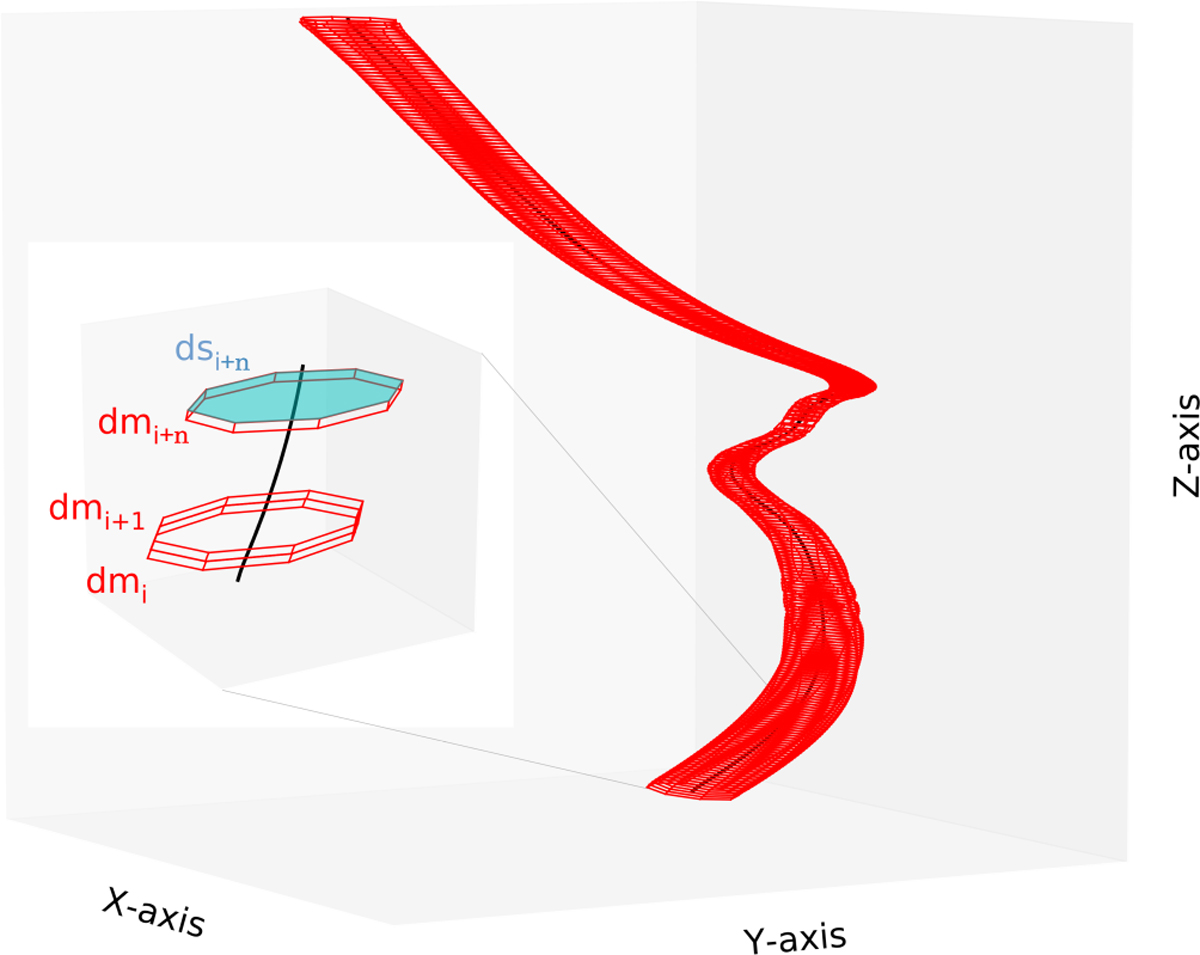
Schematic representation of the process followed to measure the mass-to-flux ratio. First, we follow magnetic field lines in our simulation box (black line). Using some basis vectors in each set of positions “i” and “i + 1” along a magnetic field line, we define convex regions as shown in the inset panel. The volume of these regions is calculated using Delaunay triangulation and the density is interpolated from data in the simulation. The surface “dsi,” used to compute the magnetic flux, is also calculated using triangulation (see text for more details).
Current usage metrics show cumulative count of Article Views (full-text article views including HTML views, PDF and ePub downloads, according to the available data) and Abstracts Views on Vision4Press platform.
Data correspond to usage on the plateform after 2015. The current usage metrics is available 48-96 hours after online publication and is updated daily on week days.
Initial download of the metrics may take a while.