Fig. B.2
Download original image
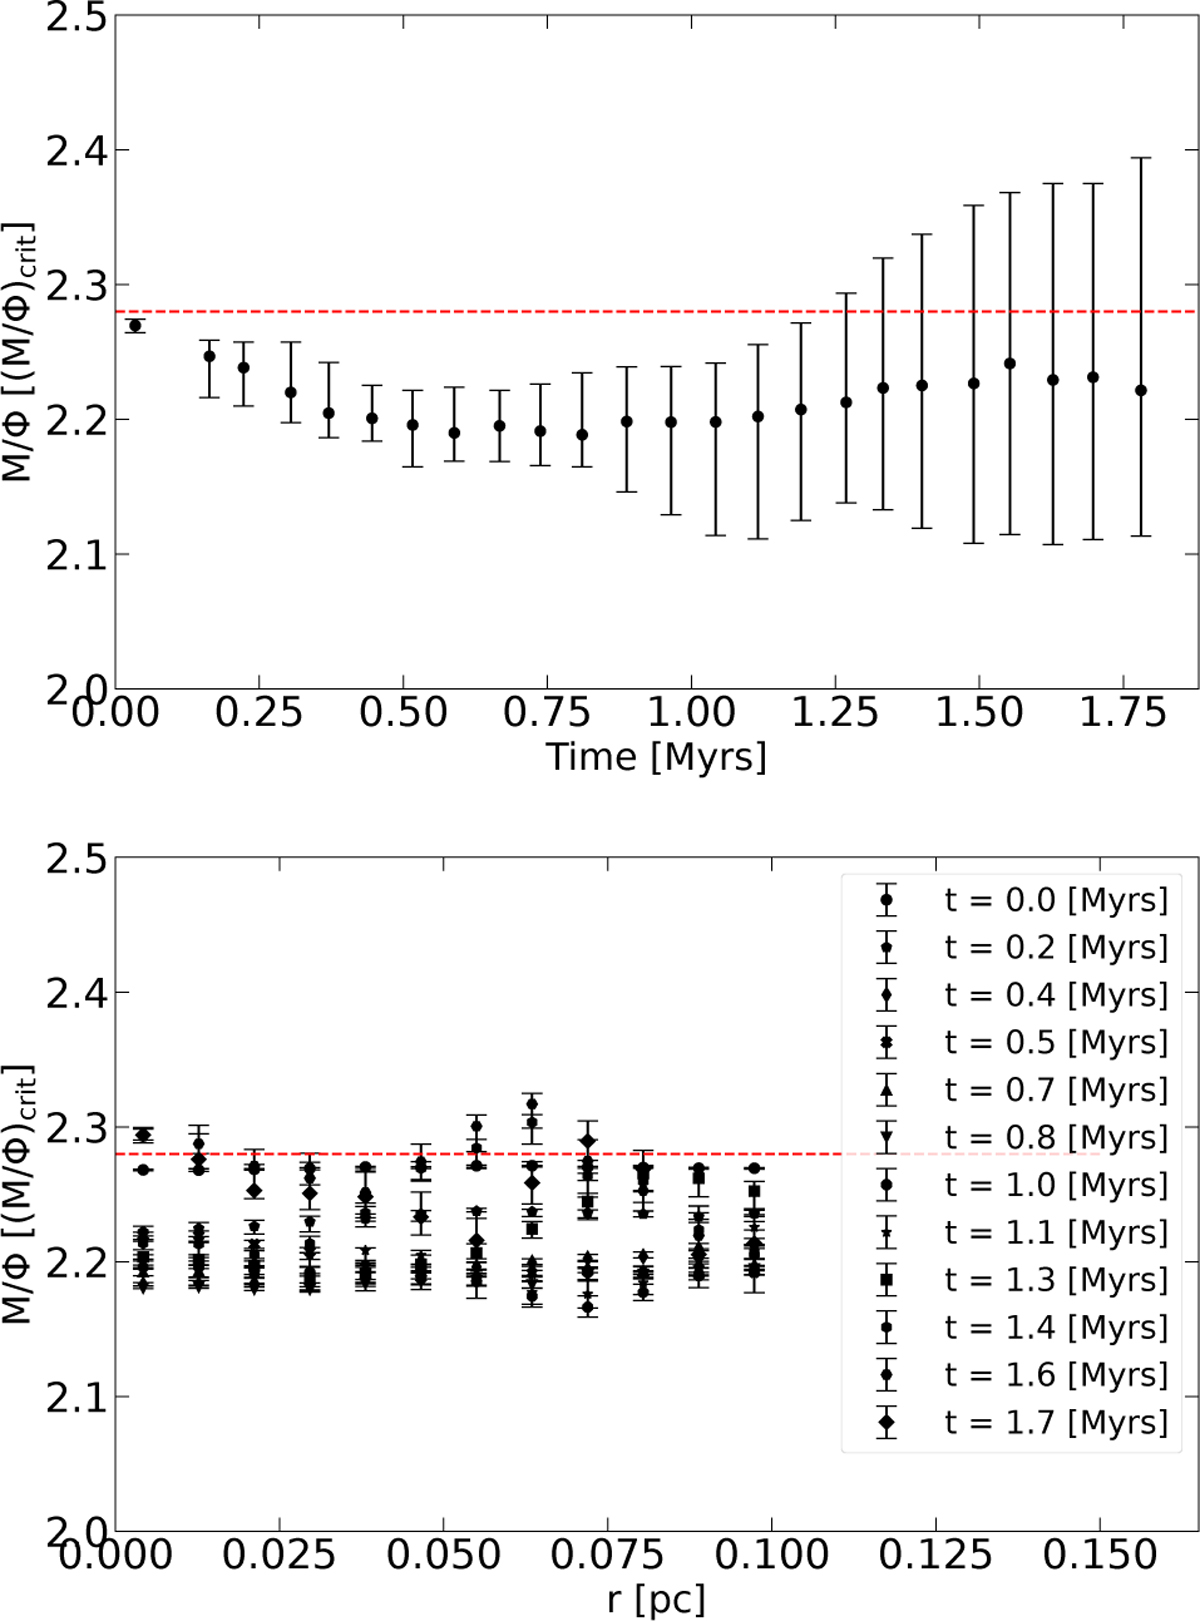
Time evolution (upper panel) and radial profiles (lower panel) of the mass-to-flux ratio in an ideal MHD simulation. The dashed red line in both panels shows the initial value of the mass-to-flux ratio in the simulation. While there are some deviations from the original value (see Sect. B.2 for further explanation), the initial mass-to-flux ratio is recovered with notable accuracy.
Current usage metrics show cumulative count of Article Views (full-text article views including HTML views, PDF and ePub downloads, according to the available data) and Abstracts Views on Vision4Press platform.
Data correspond to usage on the plateform after 2015. The current usage metrics is available 48-96 hours after online publication and is updated daily on week days.
Initial download of the metrics may take a while.