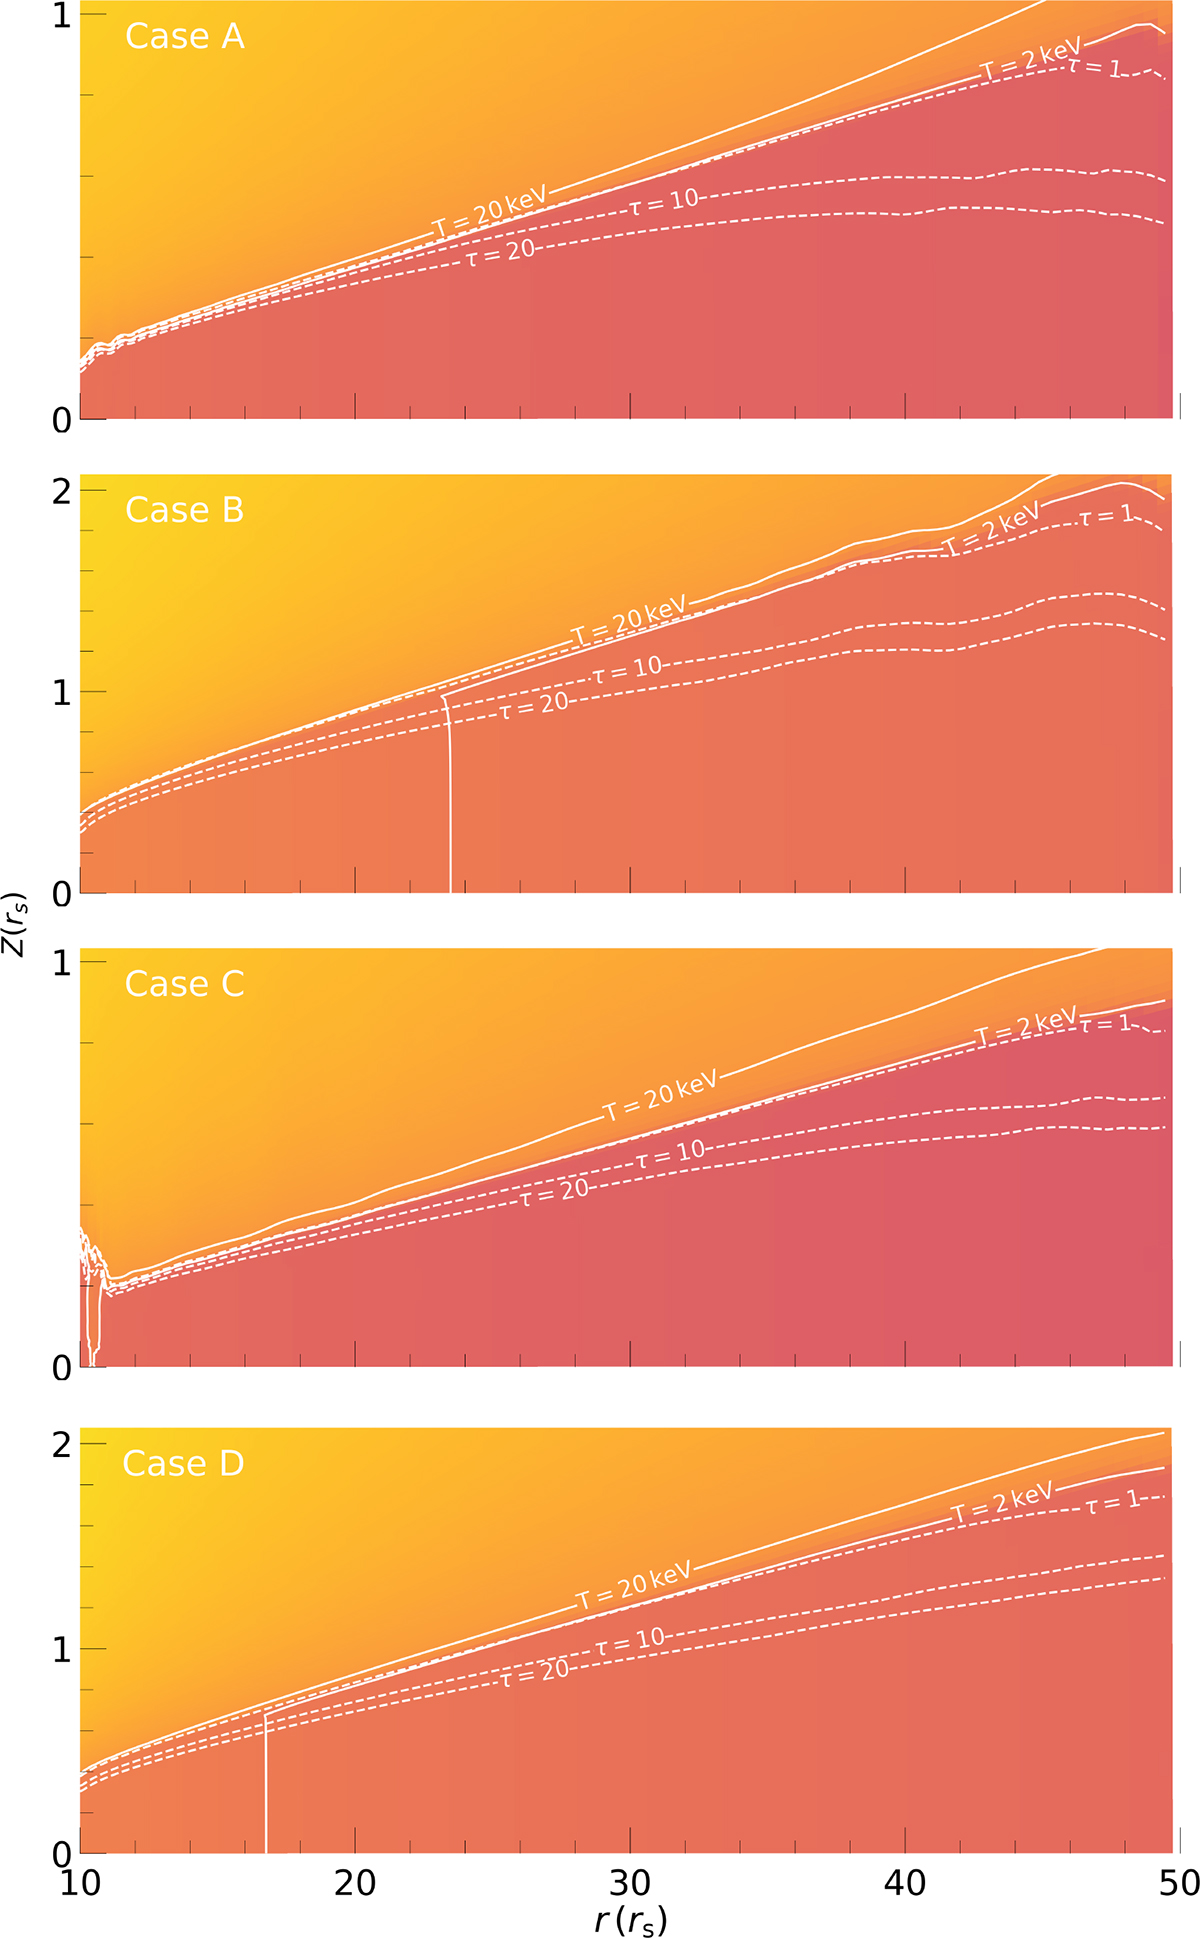
Fig. 10.
Download original image
Various characteristic contours overlaid on the background of temperature distribution map (colour-coded with the same colour bar as that of Fig. 2) near the equatorial plane for the last moments of four cases. The characteristic contours are for the temperatures T = 2, 20 keV (solid lines) and the vertical optical depth τ = 1, 10, 20 (dashed lines), respectively.
Current usage metrics show cumulative count of Article Views (full-text article views including HTML views, PDF and ePub downloads, according to the available data) and Abstracts Views on Vision4Press platform.
Data correspond to usage on the plateform after 2015. The current usage metrics is available 48-96 hours after online publication and is updated daily on week days.
Initial download of the metrics may take a while.