Open Access
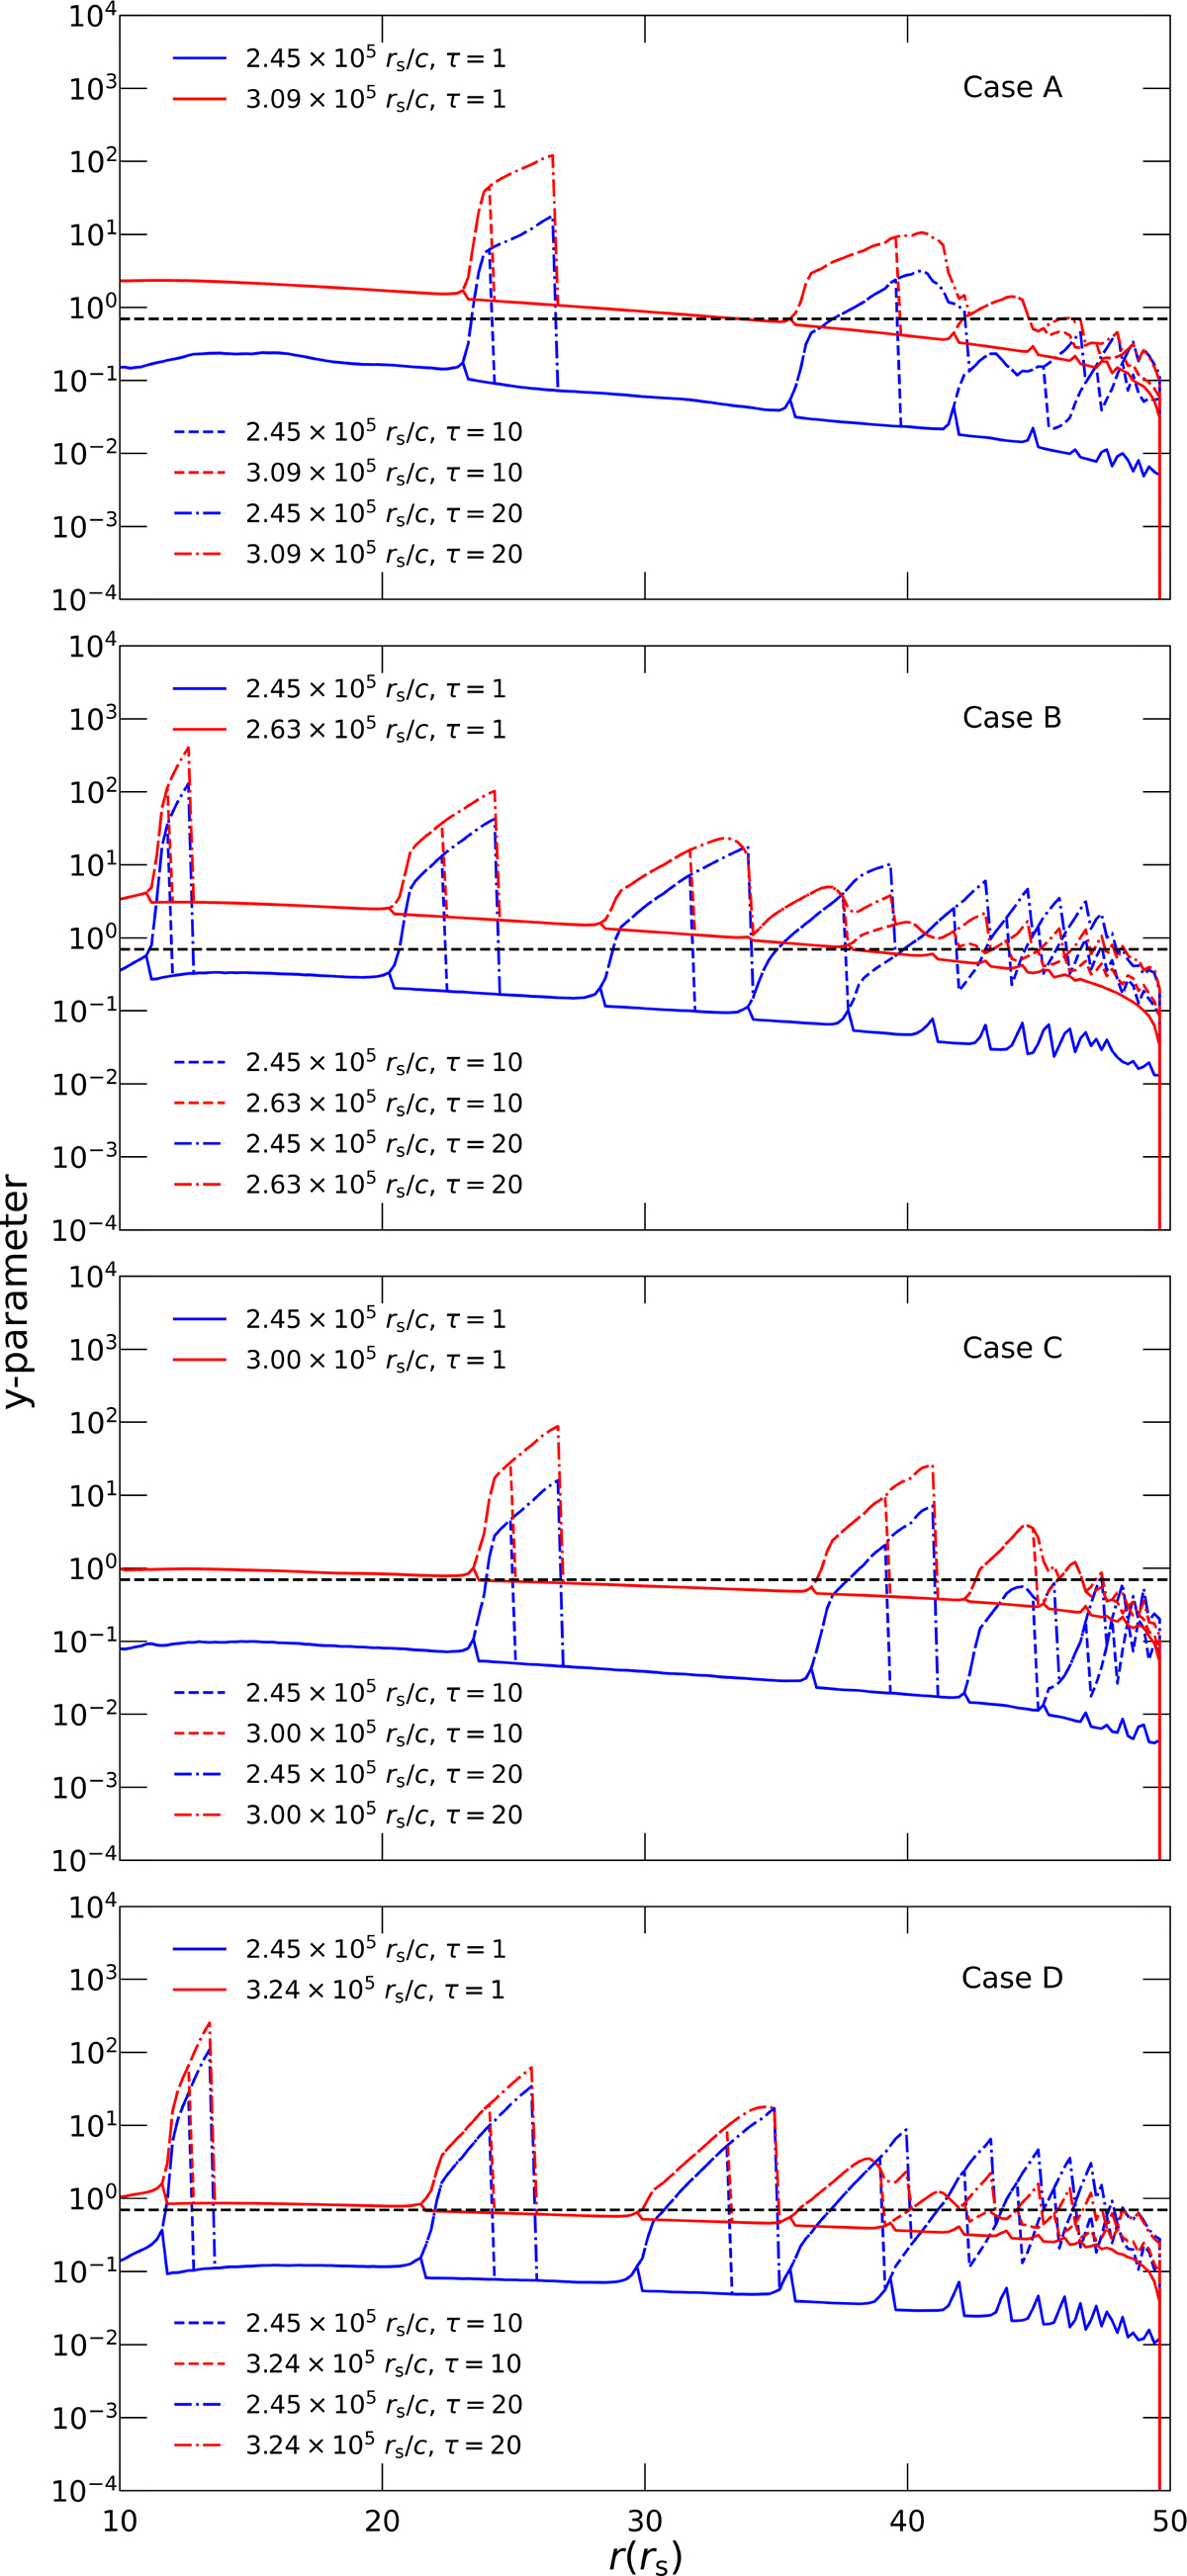
Fig. 13.
Download original image
Profiles of the y parameter for the four cases at two special moments. The horizontal dashed black line represents y = 0.7, which is the lower criterion that the continuum can be significantly affected by the inverse Compton process.
Current usage metrics show cumulative count of Article Views (full-text article views including HTML views, PDF and ePub downloads, according to the available data) and Abstracts Views on Vision4Press platform.
Data correspond to usage on the plateform after 2015. The current usage metrics is available 48-96 hours after online publication and is updated daily on week days.
Initial download of the metrics may take a while.