Open Access
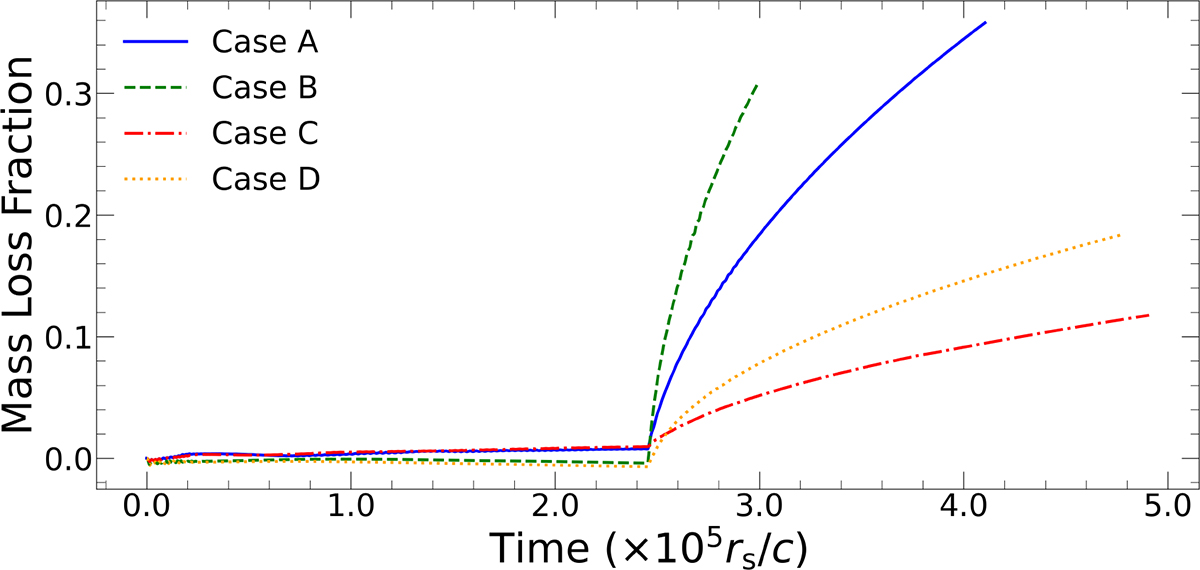
Fig. 7.
Download original image
Mass loss fraction over time for all cases, compared to the initial disc mass at t = 0. The first 2.45 × 10⁵rs/c is in the adiabatic phase, after which cooling and heating mechanisms are introduced. The different lengths of these lines correspond to varying running times (see the last line in Table 1).
Current usage metrics show cumulative count of Article Views (full-text article views including HTML views, PDF and ePub downloads, according to the available data) and Abstracts Views on Vision4Press platform.
Data correspond to usage on the plateform after 2015. The current usage metrics is available 48-96 hours after online publication and is updated daily on week days.
Initial download of the metrics may take a while.