Fig. 15.
Download original image
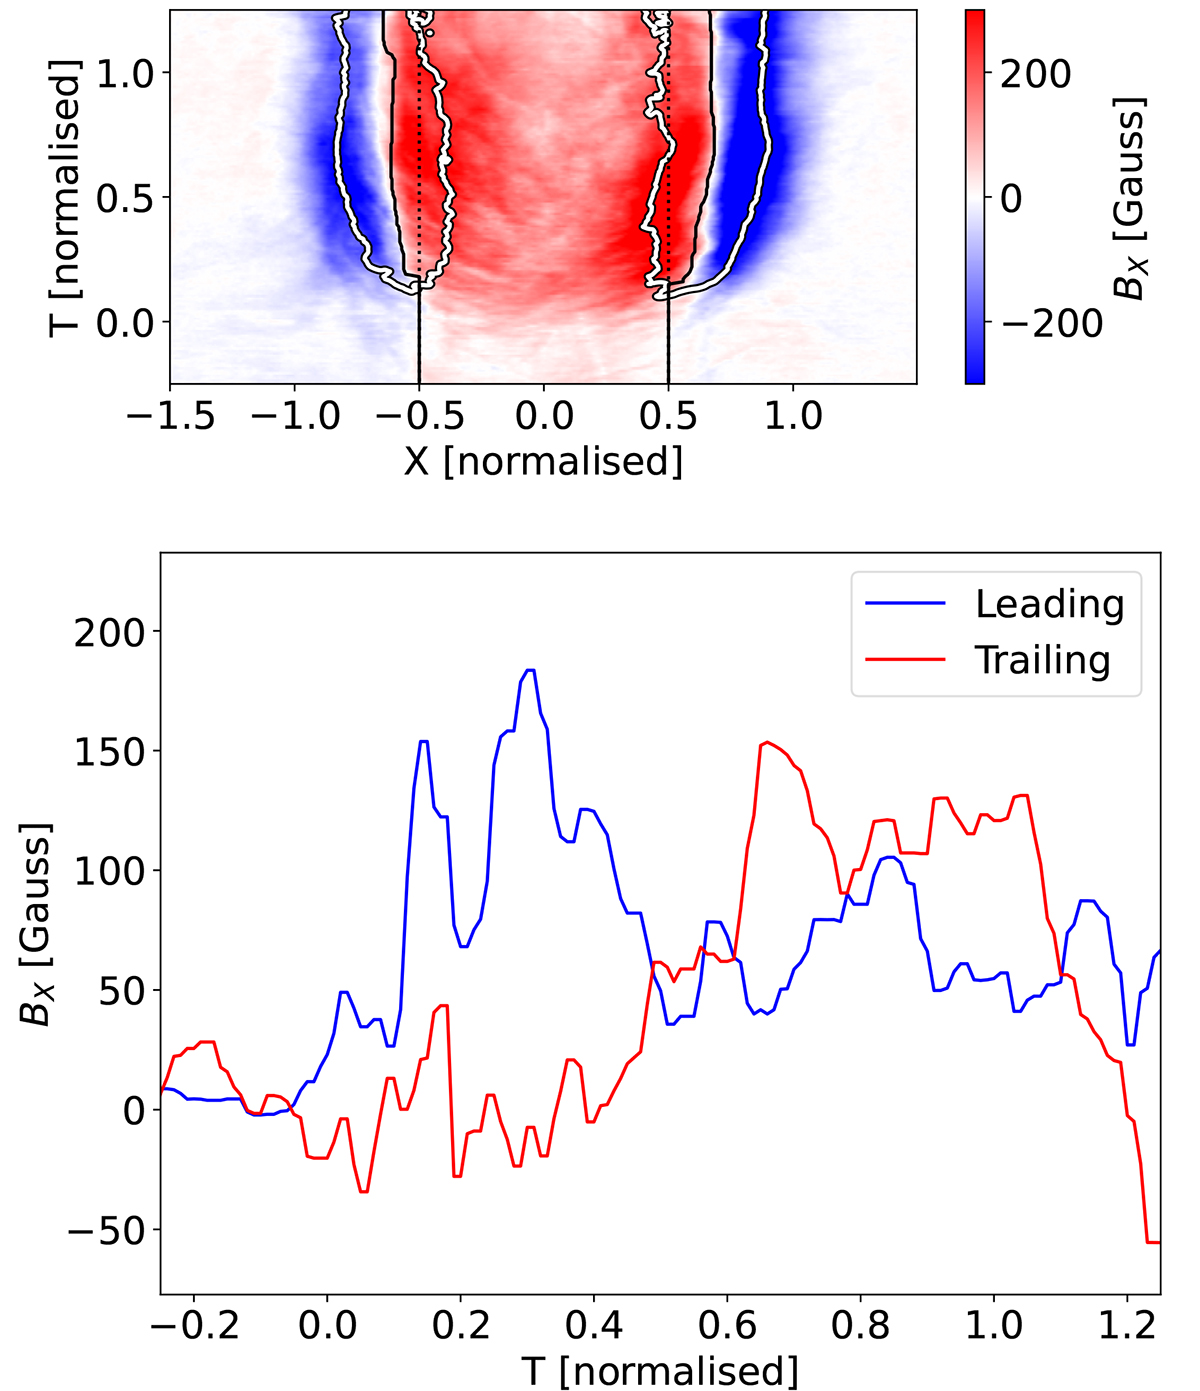
Distance–time diagrams of the zonal component of the magnetic field (BX) around the line connecting the polarities (upper panel). The black solid lines indicate the positions of the strongest vertical field, and the dotted line represents the position of the polarity barycentres. The outlined lines represent the position of ±500 G vertical field iso-contour. In the bottom panel, we plot the time evolution of the same quantity evaluated along the solid black lines. A corresponding movie is available online.
Current usage metrics show cumulative count of Article Views (full-text article views including HTML views, PDF and ePub downloads, according to the available data) and Abstracts Views on Vision4Press platform.
Data correspond to usage on the plateform after 2015. The current usage metrics is available 48-96 hours after online publication and is updated daily on week days.
Initial download of the metrics may take a while.