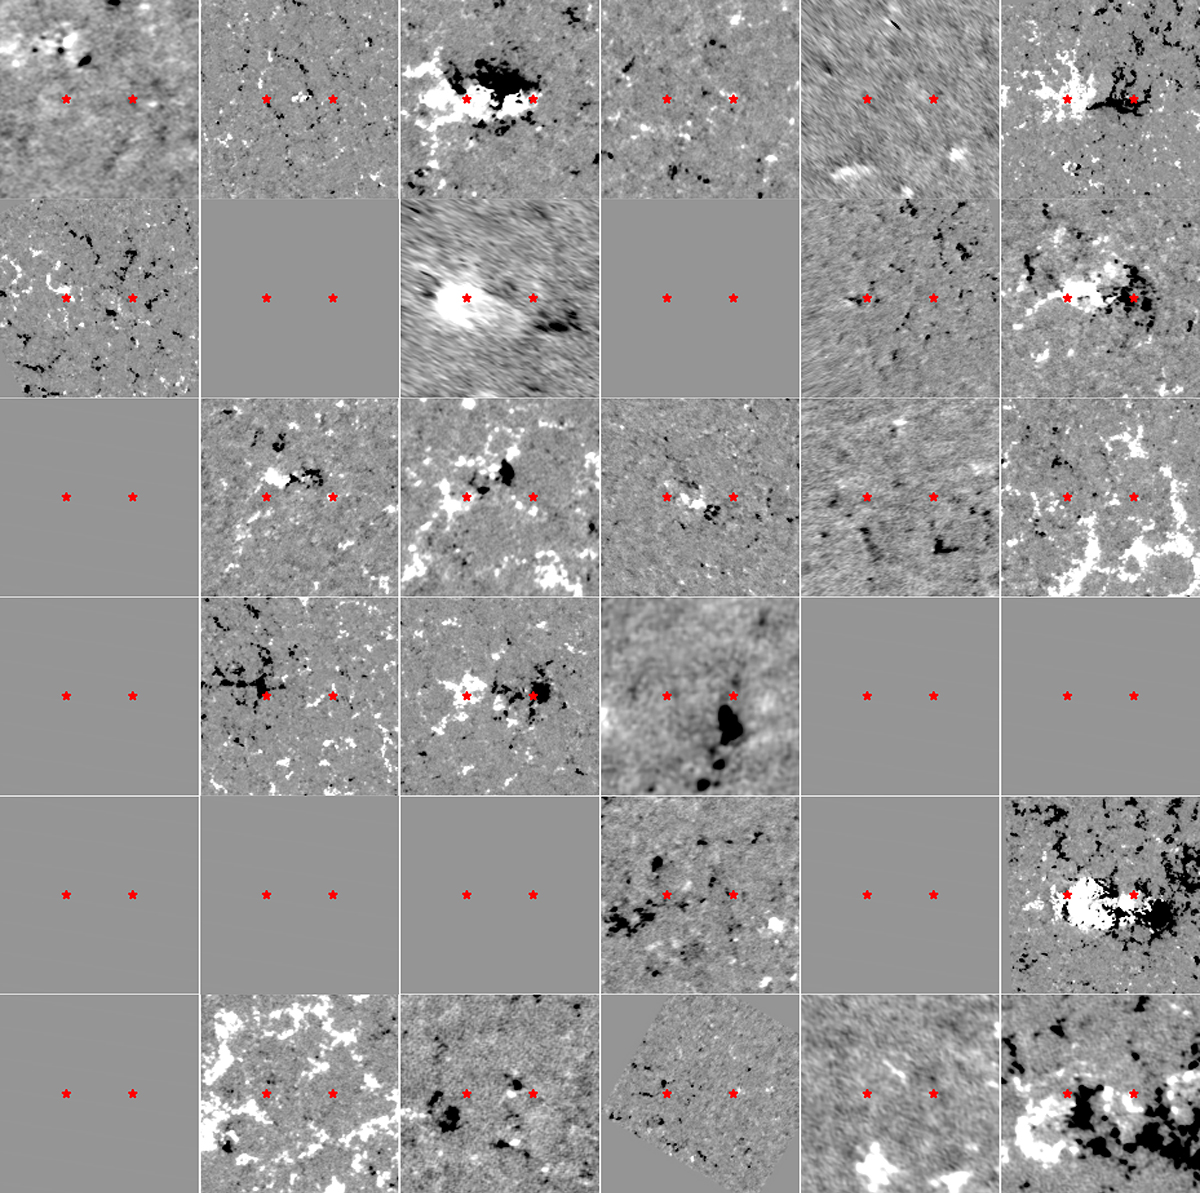
Fig. B.1.
Download original image
Line-of-sight magnetograms of the considered ARs before their emergence (at T = −0.3) in the normalised coordinates. Red stars indicate the determined positions of the polarities. We note that frames are not available for all of the ARs (some were too close to the limb to be considered). Also, the polarity positions were extrapolated from their positions after the emergence. All the subplots were saturated at ±100 Gauss.
Current usage metrics show cumulative count of Article Views (full-text article views including HTML views, PDF and ePub downloads, according to the available data) and Abstracts Views on Vision4Press platform.
Data correspond to usage on the plateform after 2015. The current usage metrics is available 48-96 hours after online publication and is updated daily on week days.
Initial download of the metrics may take a while.