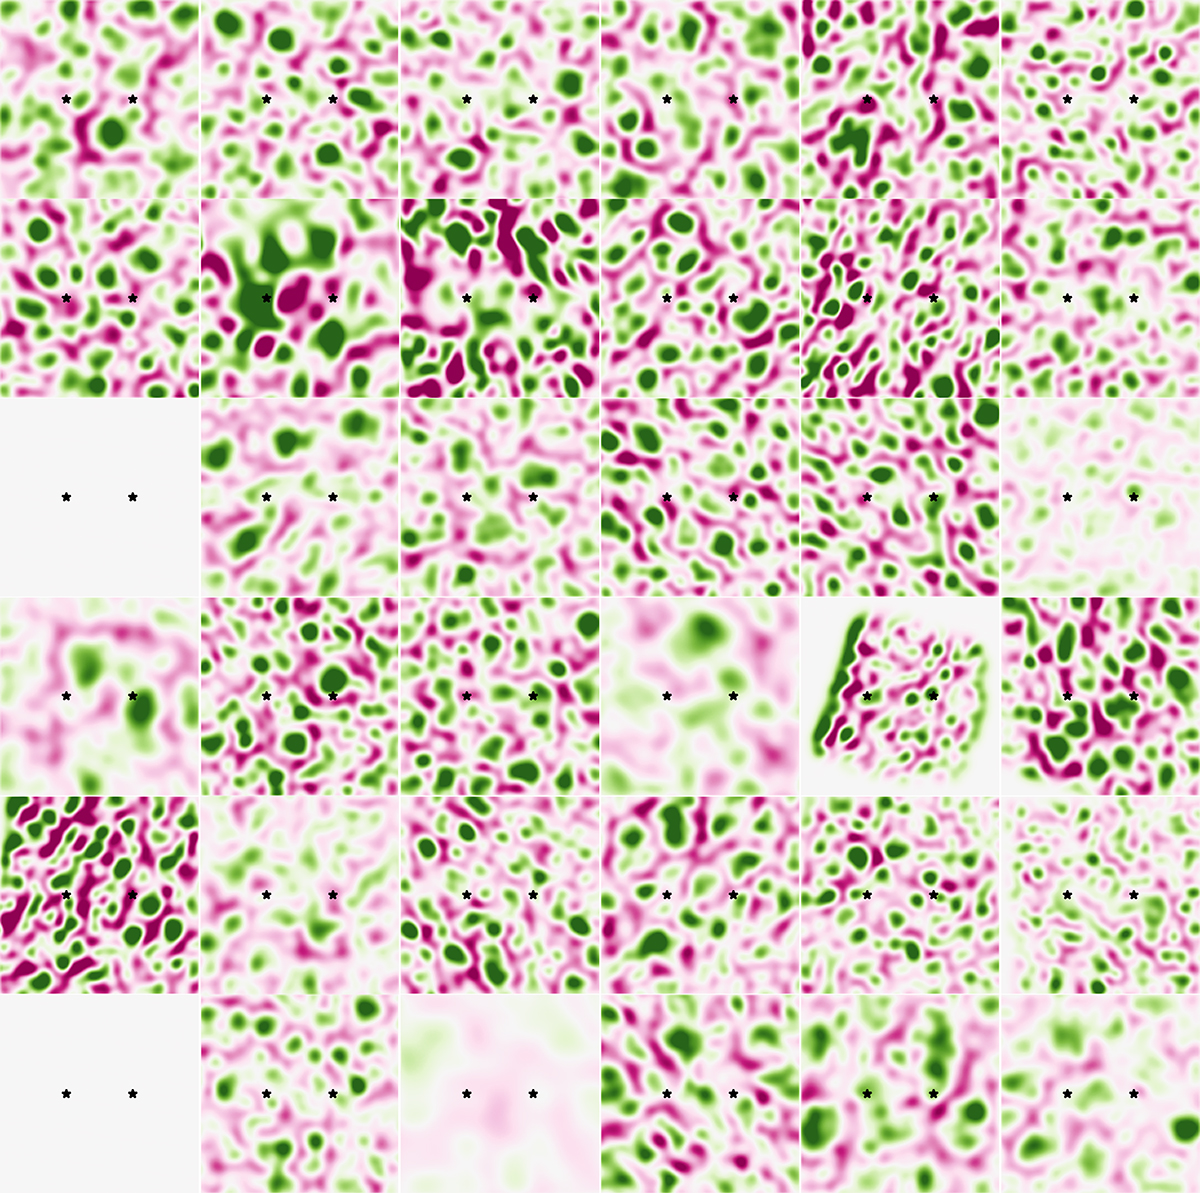
Fig. B.3.
Download original image
Horizontal flow divergences of the considered active regions before their emergence (at T = −0.05) in the normalised coordinates. Black stars indicate the determined positions of the polarities. We note that not for all ARs the frames are available (they were too close to the limb to be considered). All the subplots were saturated at ±0.01, which roughly corresponds to ±0.036 s−1. Green colour indicates a positive horizontal divergence, purple the negative one (a convergence). Over the fields of view, the divergence pattern is dominated by supergranular flows.
Current usage metrics show cumulative count of Article Views (full-text article views including HTML views, PDF and ePub downloads, according to the available data) and Abstracts Views on Vision4Press platform.
Data correspond to usage on the plateform after 2015. The current usage metrics is available 48-96 hours after online publication and is updated daily on week days.
Initial download of the metrics may take a while.