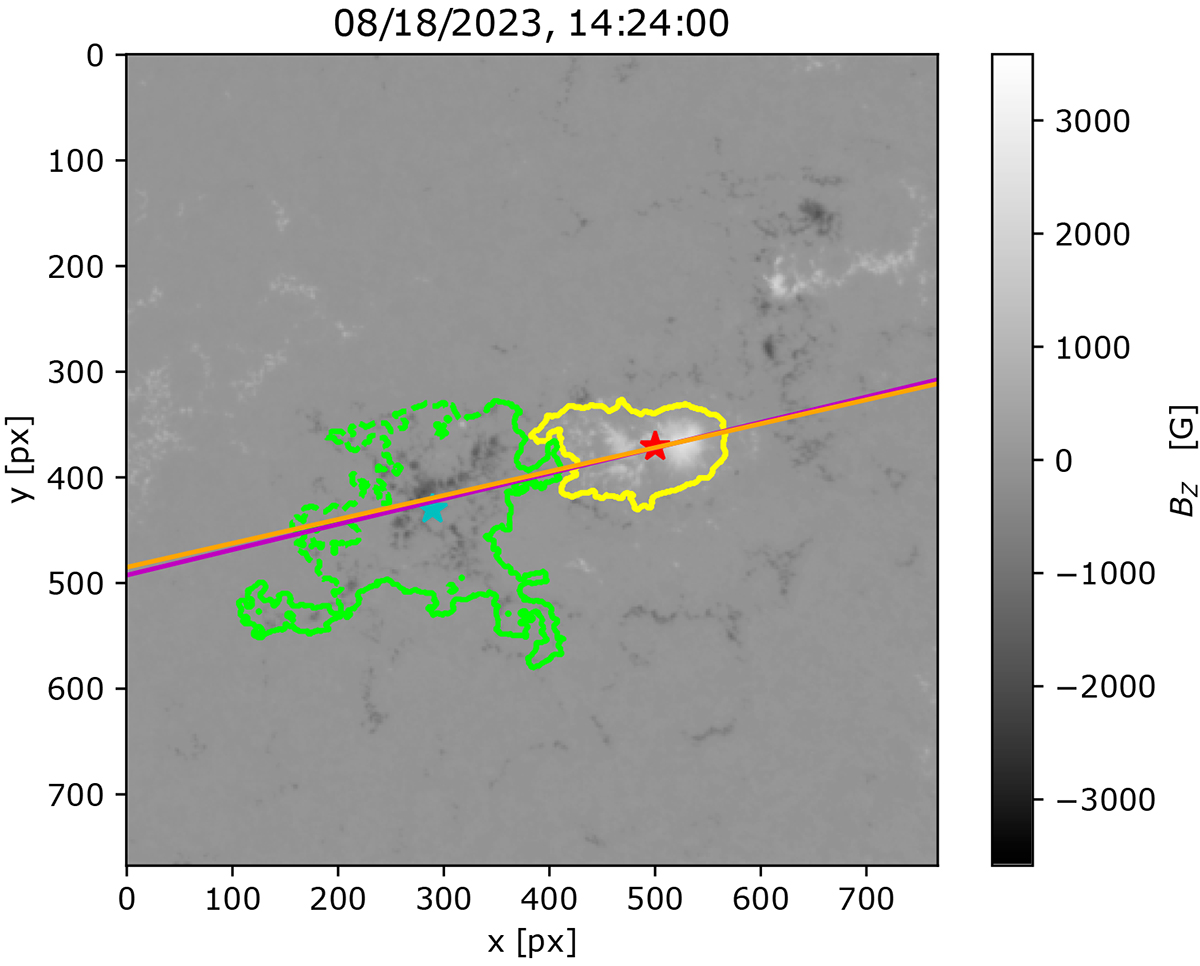
Fig. C.1.
Download original image
Demonstrative frame showing the performance of the automatic procedure to detect the magnetic polarities. The isolines outline compact regions of the positive (yellow) and negative (lime) polarity. The red star indicates the center of mass of the positive polarity within the outlined region, the blue star then the same for the negative polarity. The purple line then represents the linear fit through the unsigned magnetic field that represents the axis of the active region at the given time, the orange line has the same meaning, only the fit was obtained for vertical field stronger than 500 G.
Current usage metrics show cumulative count of Article Views (full-text article views including HTML views, PDF and ePub downloads, according to the available data) and Abstracts Views on Vision4Press platform.
Data correspond to usage on the plateform after 2015. The current usage metrics is available 48-96 hours after online publication and is updated daily on week days.
Initial download of the metrics may take a while.