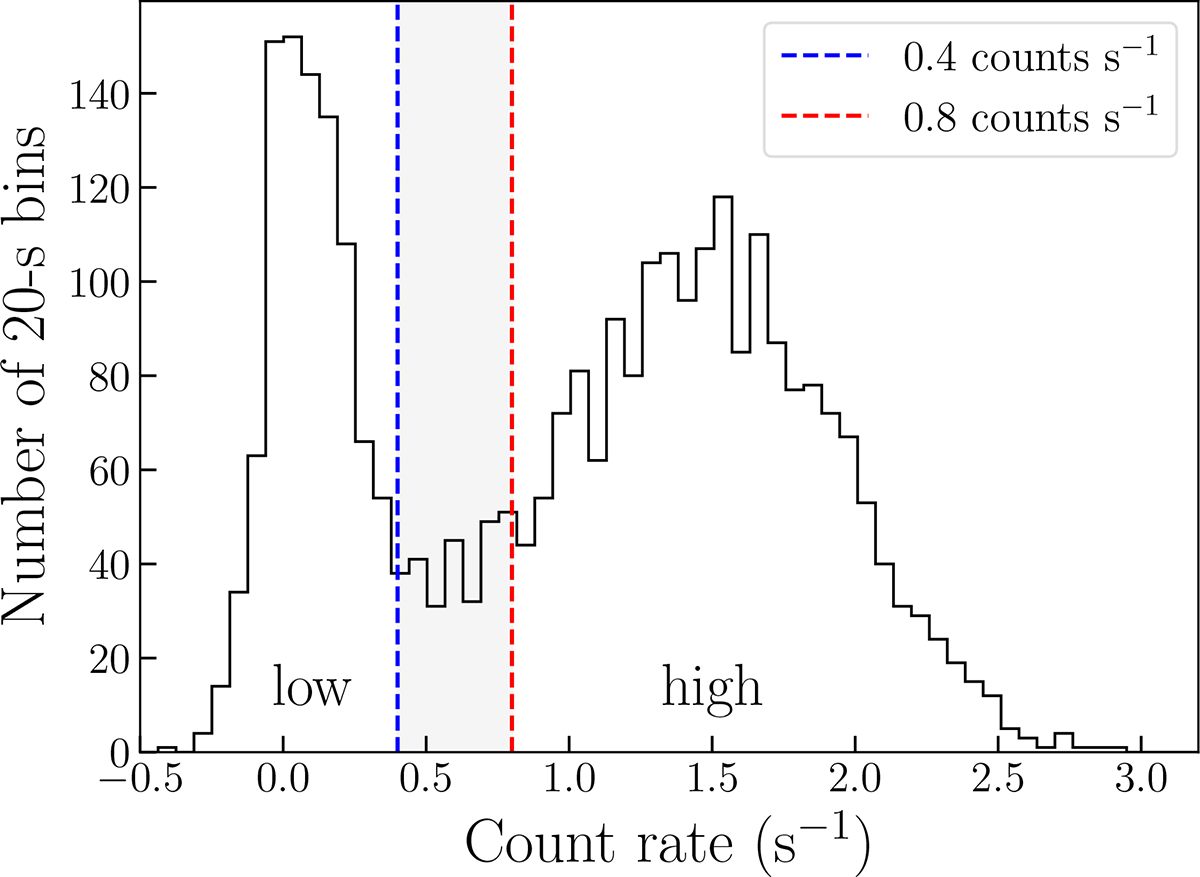
Fig. 1.
Download original image
Distribution of count rates obtained from the background-subtracted XMM-Newton/EPIC light curve acquired on 2024 February 8 binned with a time resolution of 20 s. We defined the high modes as the time intervals when the count rate exceeded 0.8 counts s−1 (red dashed line), and the low modes as those when the count rate dropped below 0.4 counts s−1 (blue dashed line). A “transition” region is also present, following the procedure adopted by Bogdanov et al. (2015) for J1023. No flaring mode was observed.
Current usage metrics show cumulative count of Article Views (full-text article views including HTML views, PDF and ePub downloads, according to the available data) and Abstracts Views on Vision4Press platform.
Data correspond to usage on the plateform after 2015. The current usage metrics is available 48-96 hours after online publication and is updated daily on week days.
Initial download of the metrics may take a while.