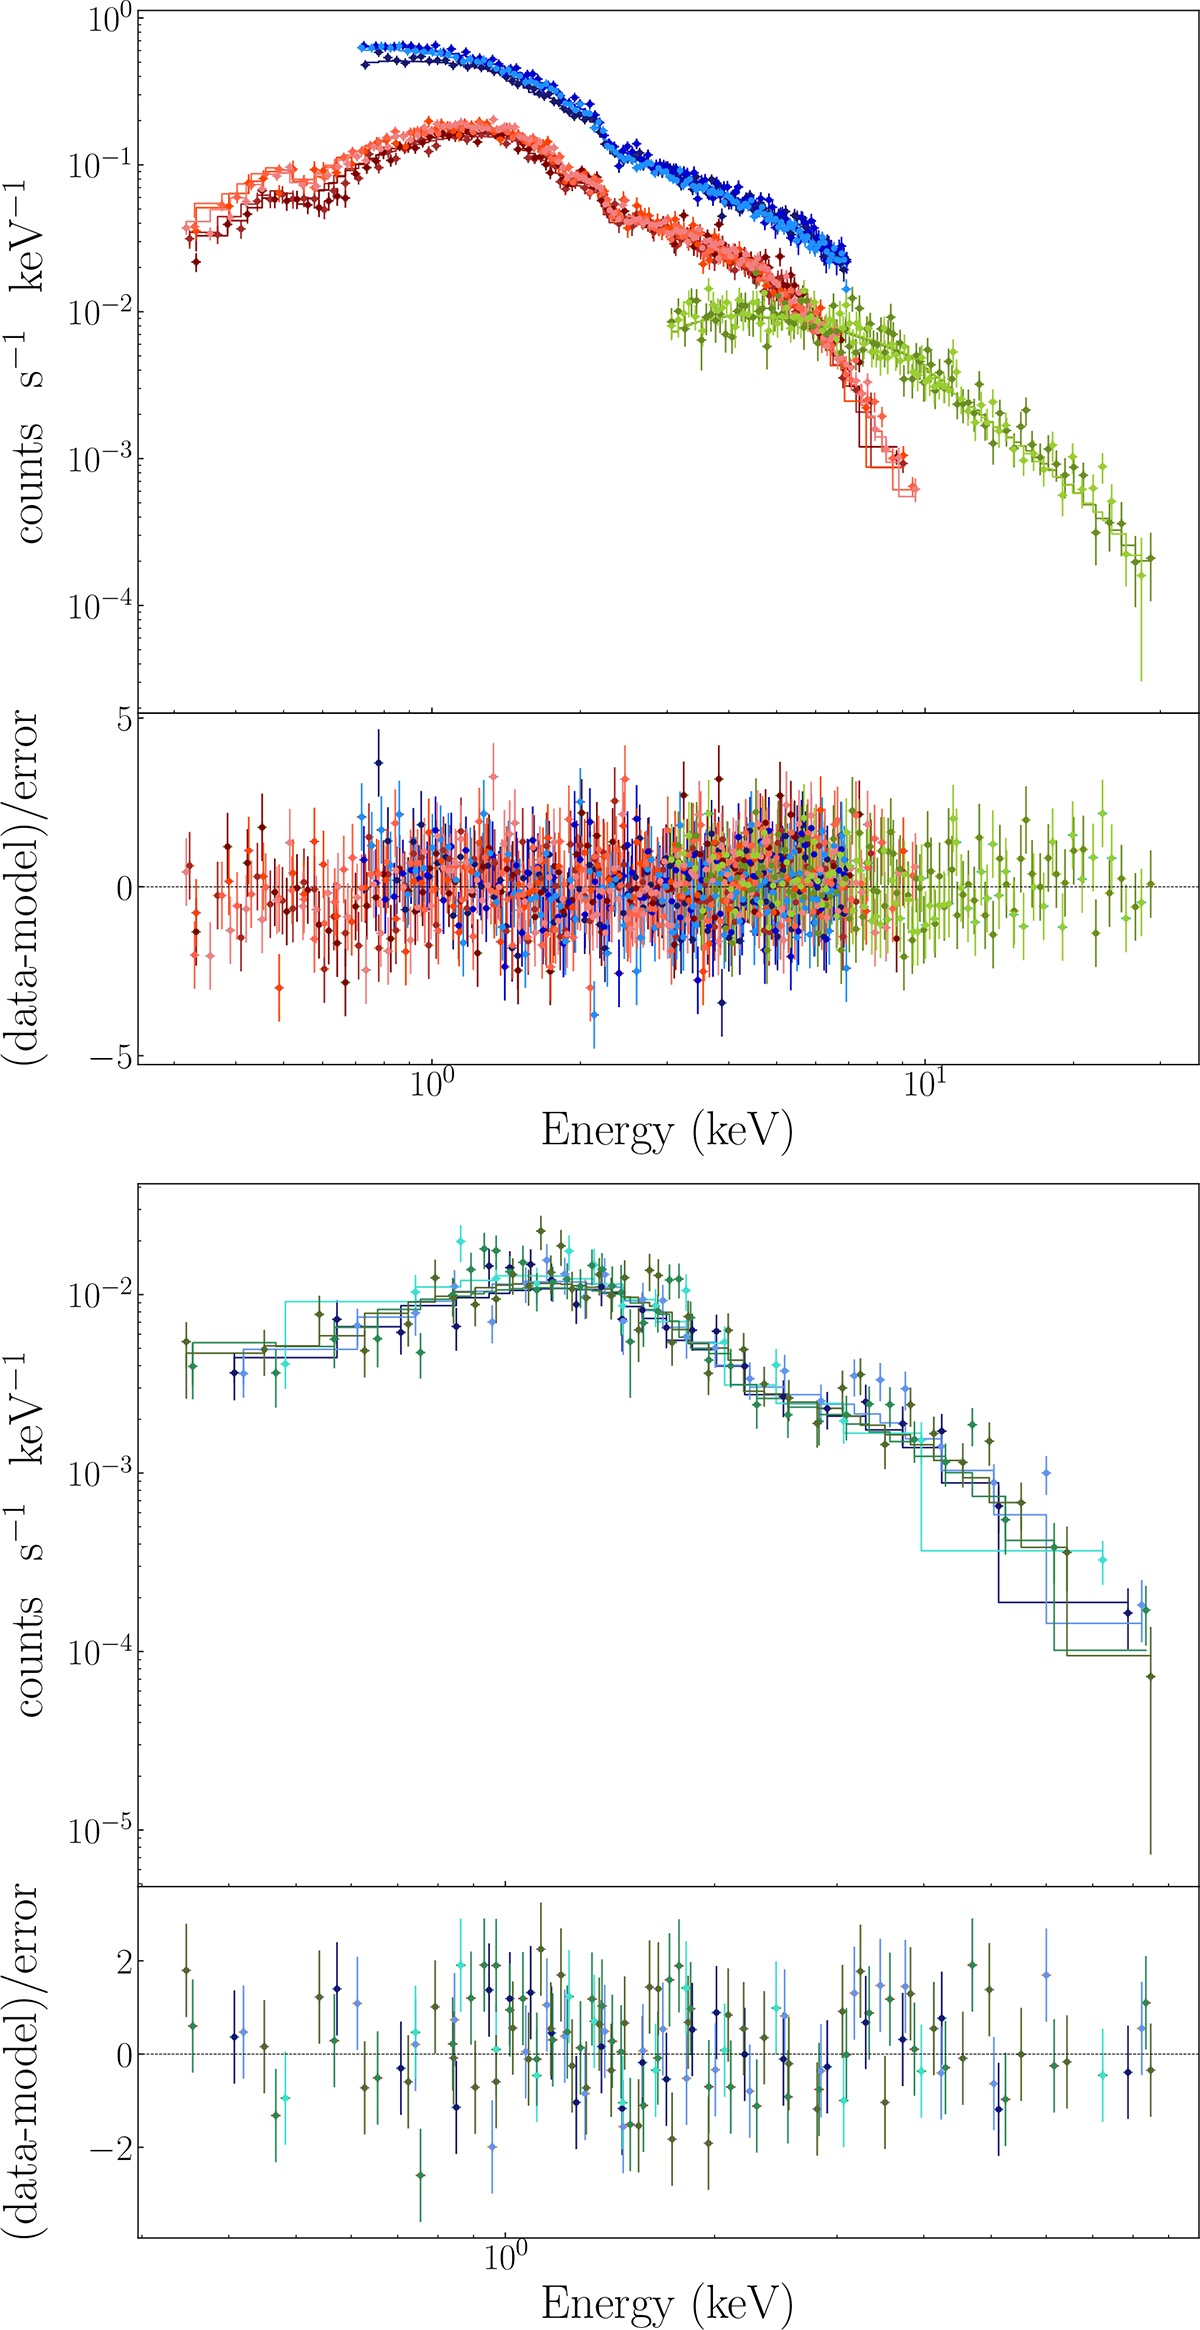
Fig. A.1.
Download original image
X-ray spectra extracted separately in the high-mode (top panel) and low-mode (bottom panel) intervals, along with the best-fitting models (see Appendix A for details). Top panel: Various shades of blue denote the three EPIC-pn spectra, while different shades of red represent the spectra obtained with the two EPIC-MOS cameras. Light and dark green indicate NuSTAR spectra. Bottom panel: As discussed in the text, the low-mode spectrum includes only data for the two EPIC-MOS cameras.
Current usage metrics show cumulative count of Article Views (full-text article views including HTML views, PDF and ePub downloads, according to the available data) and Abstracts Views on Vision4Press platform.
Data correspond to usage on the plateform after 2015. The current usage metrics is available 48-96 hours after online publication and is updated daily on week days.
Initial download of the metrics may take a while.