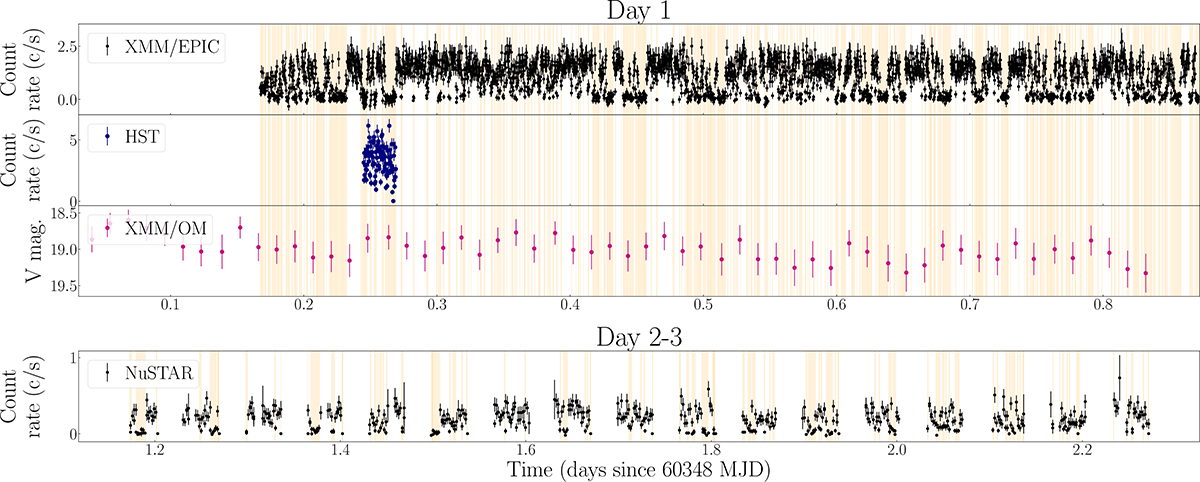
Fig. 2.
Download original image
Temporal evolution of the X-ray, UV, and optical emissions of J1544 during the first three days of observations. For Day 1, the light curves are shown in decreasing order of energy band, from top to bottom, with the XMM-Newton/EPIC (20 s time bin), HST/STIS (20 s), and XMM-Newton/OM (1200 s). For Days 2–3, the 3–30 keV NuSTAR light curve (100 s time bin) is shown. The yellow-shaded areas denote the time intervals of the low X-ray mode identified by XMM-Newton/EPIC on Day 1 and by NuSTAR on Day 2–3. The error bars represent 1σ uncertainties.
Current usage metrics show cumulative count of Article Views (full-text article views including HTML views, PDF and ePub downloads, according to the available data) and Abstracts Views on Vision4Press platform.
Data correspond to usage on the plateform after 2015. The current usage metrics is available 48-96 hours after online publication and is updated daily on week days.
Initial download of the metrics may take a while.