Open Access
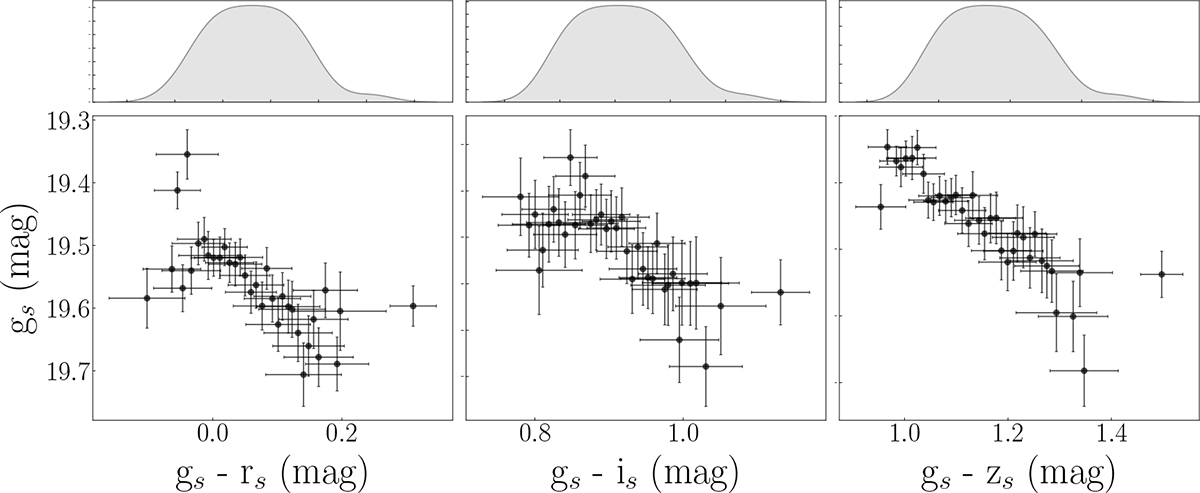
Fig. 5.
Download original image
Color-magnitude diagrams for J1544 derived from the most highly sampled gS, rS, iS, and zS bands of the GTC/HiPERCAM time series (Fig. 4) and rebinned to emphasize correlation trends. The upper panels display the smoothed Kernel Density Estimation curves that illustrate the distribution of the color-magnitude values.
Current usage metrics show cumulative count of Article Views (full-text article views including HTML views, PDF and ePub downloads, according to the available data) and Abstracts Views on Vision4Press platform.
Data correspond to usage on the plateform after 2015. The current usage metrics is available 48-96 hours after online publication and is updated daily on week days.
Initial download of the metrics may take a while.