Fig. 9.
Download original image
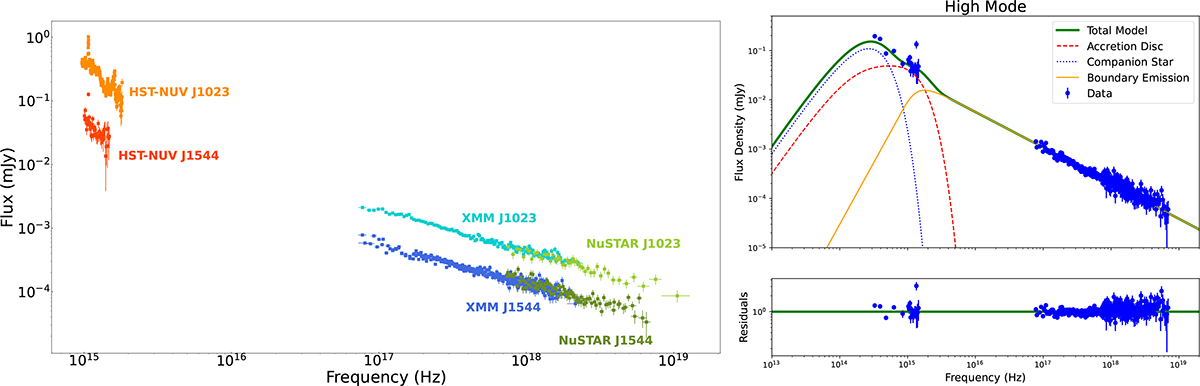
Unabsorbed broadband SED of J1544. Left panel: SED of J1544 from UV to X-rays compared with that of J1023 from Miraval Zanon et al. (2022). For J1023 and J1544, HST data are shown in orange and red, XMM-Newton data are in light blue and dark blue, and NuSTAR data are in light green and dark green, respectively. The HST spectrum is plotted from 165 to 310 nm (i.e., ∼(1.0 − 1.8)×1015 Hz) for J1023 and from 200 to 300 nm (i.e., ∼(1.0 − 1.5)×1015 Hz) for J1544. The UV data were rebinned using the coronagraph Python package (Robinson et al. 2016; Lustig-Yaeger et al. 2019) with a low-resolution wavelength grid of width 4 for J1023 and width 20 for J1544. Right panel: The SED of J1544 from the optical band to X-rays, extracted during X-ray high modes observed with XMM-Newton, along with the best-fitting model (see text for details). Due to the lack of simultaneous X-ray observations, we include all available optical data from GTC/HiPERCAM. The red dashed, blue dotted, and orange solid lines represent the contributions from the accretion disk, companion star, and boundary region, respectively, while the green solid line shows their combined emission. The ratio between the data points and the best-fitting model is shown in the bottom panel.
Current usage metrics show cumulative count of Article Views (full-text article views including HTML views, PDF and ePub downloads, according to the available data) and Abstracts Views on Vision4Press platform.
Data correspond to usage on the plateform after 2015. The current usage metrics is available 48-96 hours after online publication and is updated daily on week days.
Initial download of the metrics may take a while.