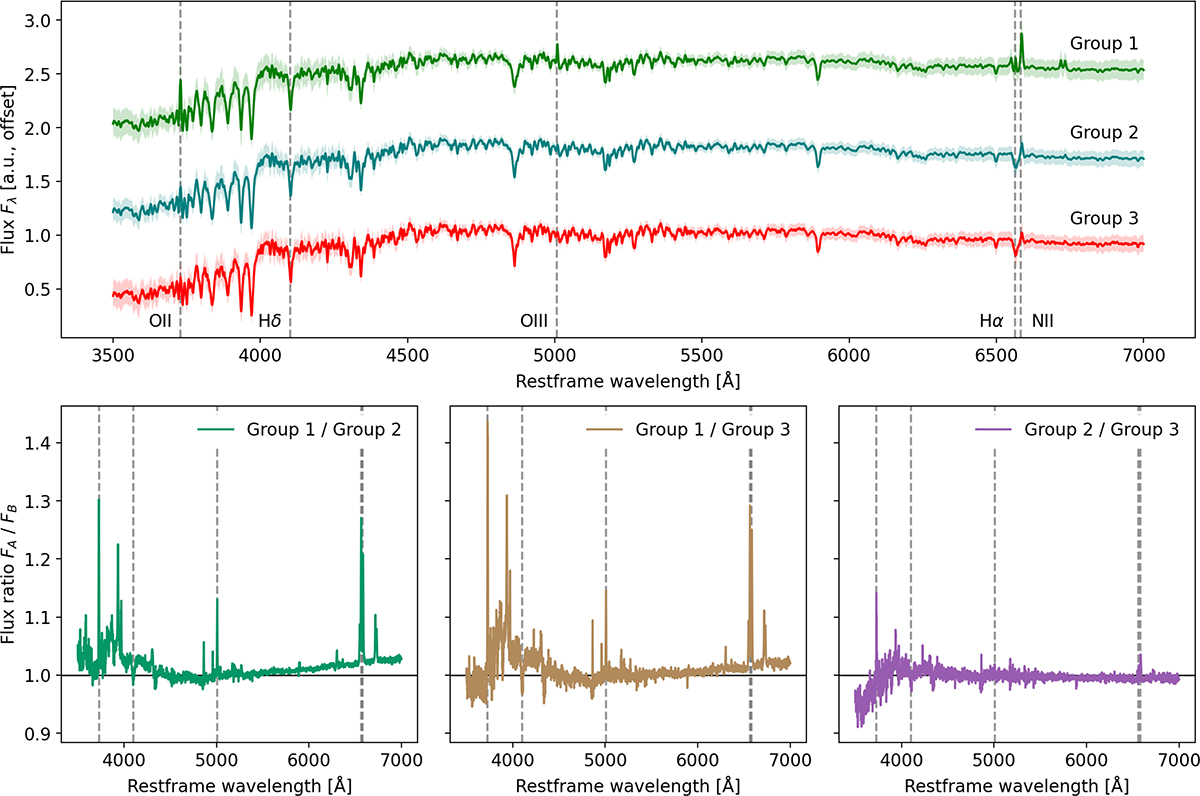
Fig. 4.
Download original image
Top: stacked SEDs for the PSB groups identified in the Meusinger et al. (2017) catalog. Groups 1, 2, and 3 are shown from top to bottom. Prior to stacking, the SEDs were normalized by the mean flux in the 5050–5150 Å region to account for redshift dependences (identical continua were assumed). All SEDs were given equal weight, but only spectra with a signal-to-noise ratio > 5 for the g, r, and i bands were included (this includes > 97% of the galaxies in the catalog). 16th and 84th percentiles are shown within the shaded area, and selected spectral lines are highlighted. Bottom: flux ratios.
Current usage metrics show cumulative count of Article Views (full-text article views including HTML views, PDF and ePub downloads, according to the available data) and Abstracts Views on Vision4Press platform.
Data correspond to usage on the plateform after 2015. The current usage metrics is available 48-96 hours after online publication and is updated daily on week days.
Initial download of the metrics may take a while.