Open Access
Fig. 8.
Download original image
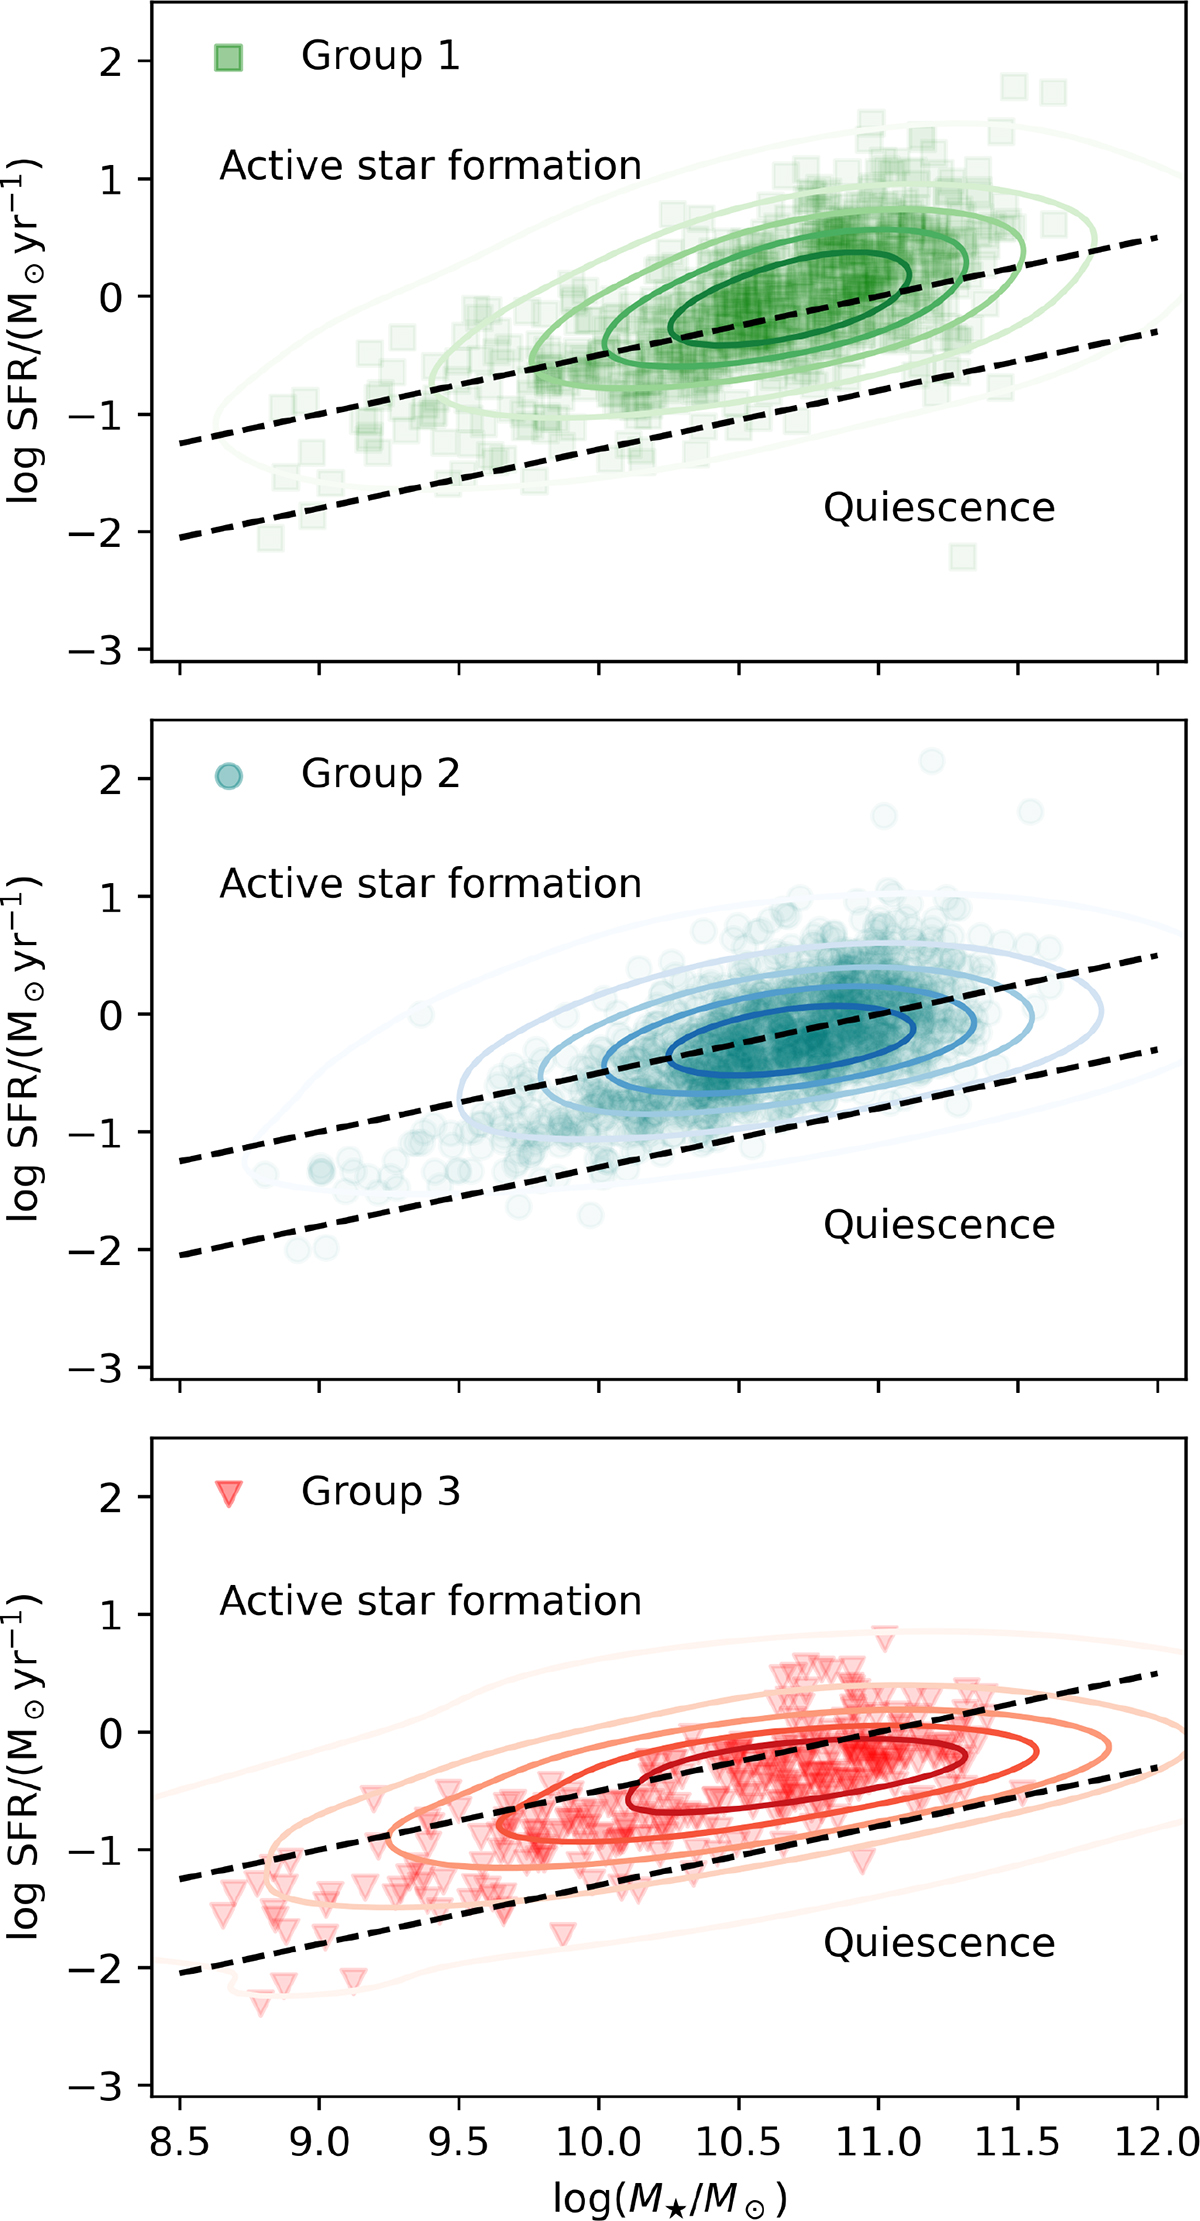
Star formation rate vs. stellar mass parameter space for each of the PSB groups in the Meusinger et al. (2017) catalog. Groups 1, 2, and 3 are shown from top to bottom. The galaxy properties were taken from the MPA-JHU catalog, and the transitional region is outlined by the dashed lines following Li et al. (2023).
Current usage metrics show cumulative count of Article Views (full-text article views including HTML views, PDF and ePub downloads, according to the available data) and Abstracts Views on Vision4Press platform.
Data correspond to usage on the plateform after 2015. The current usage metrics is available 48-96 hours after online publication and is updated daily on week days.
Initial download of the metrics may take a while.