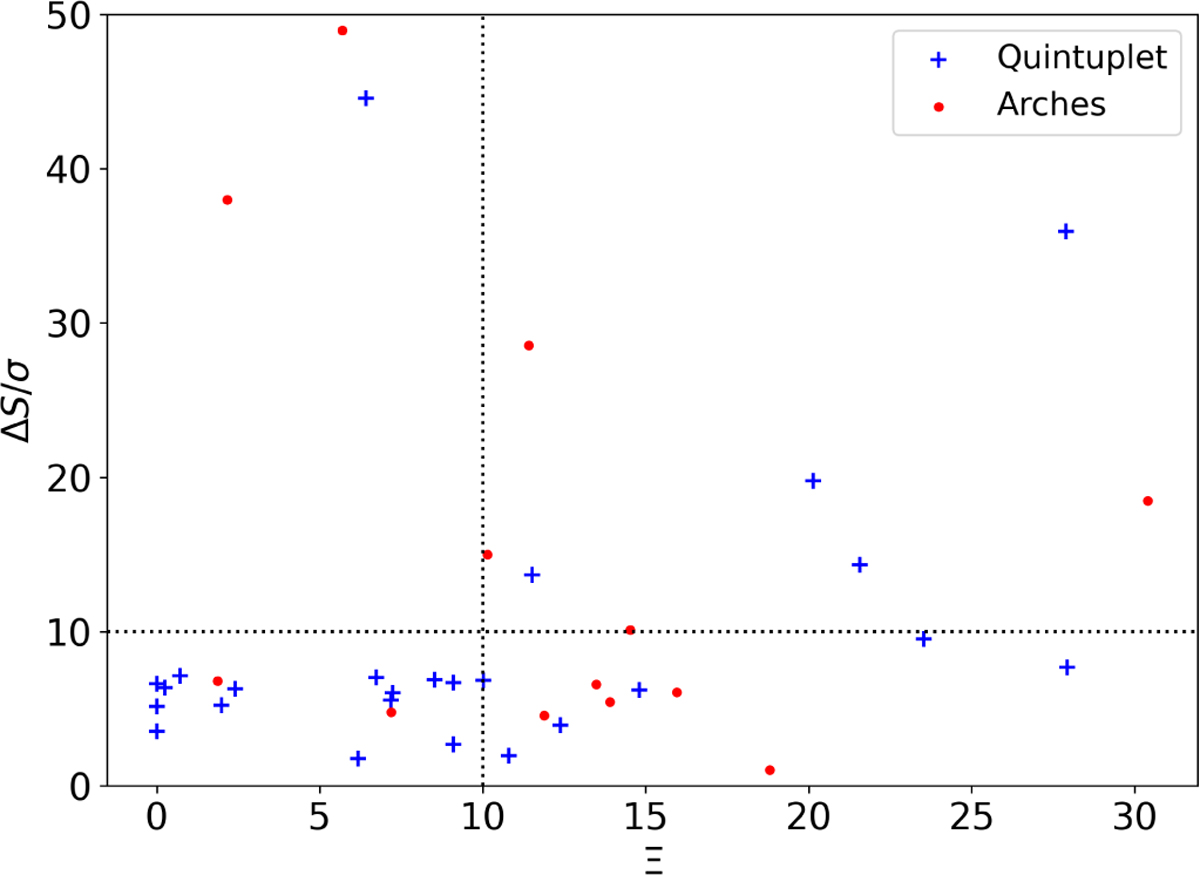
Fig. 4
Download original image
Flux density variability as a function of spectral index variability across all epochs for both the Arches and Quintuplet clusters. The black dotted lines indicate ∆S/σ = 10 and Ξ = 10 values, which are indicative of high flux and spectral index variability. Table 4 shows the uncertainties of the plotted values, but we refrained from showing error bars in this plot for the sake of clarity.
Current usage metrics show cumulative count of Article Views (full-text article views including HTML views, PDF and ePub downloads, according to the available data) and Abstracts Views on Vision4Press platform.
Data correspond to usage on the plateform after 2015. The current usage metrics is available 48-96 hours after online publication and is updated daily on week days.
Initial download of the metrics may take a while.