Fig. 7
Download original image
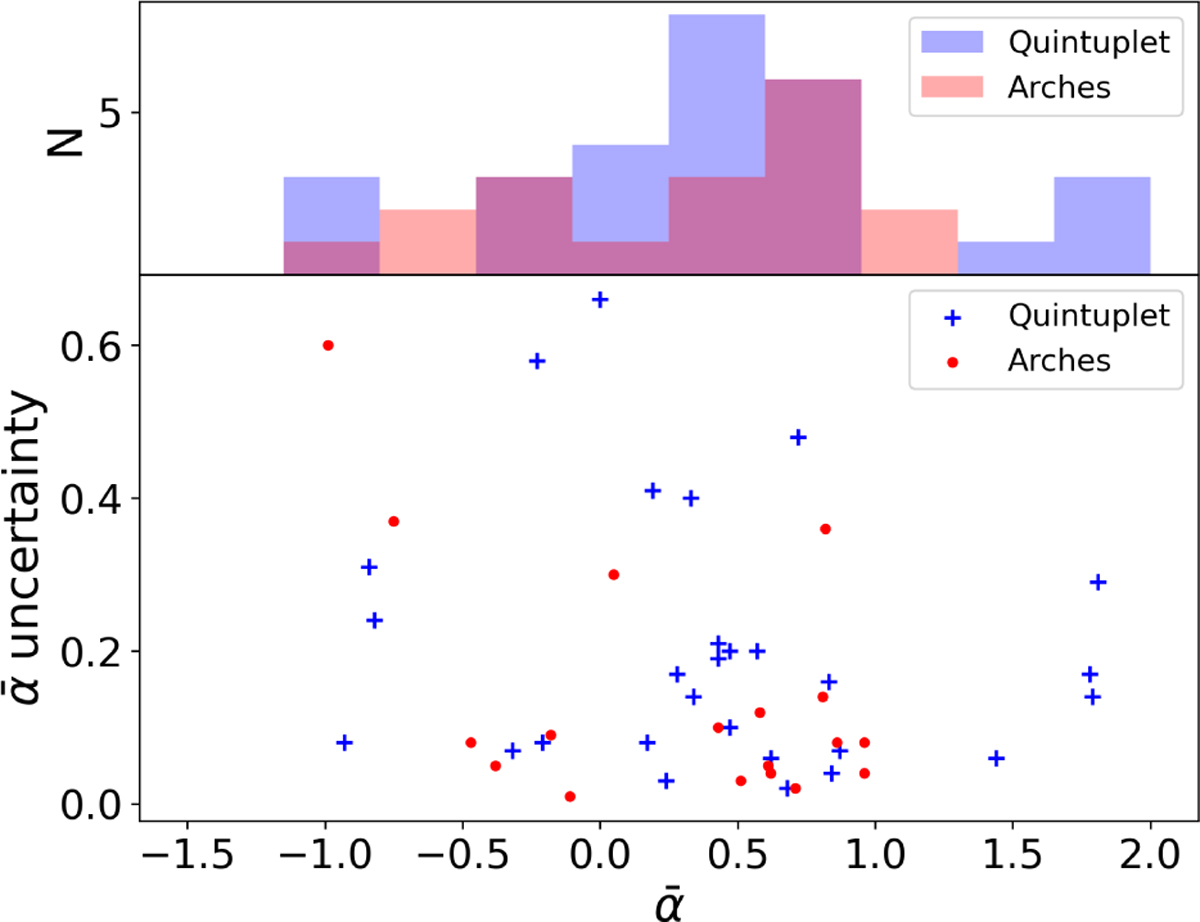
Top: histogram of the weighted mean of the spectral index for the radio stars of both clusters. Arches cluster data are in red; Quintuplet data are in blue. Bottom: uncertainty of the spectral index weighted mean versus spectral index weighted mean for both clusters. The values for Quintuplet are the same as those in Table 4.
Current usage metrics show cumulative count of Article Views (full-text article views including HTML views, PDF and ePub downloads, according to the available data) and Abstracts Views on Vision4Press platform.
Data correspond to usage on the plateform after 2015. The current usage metrics is available 48-96 hours after online publication and is updated daily on week days.
Initial download of the metrics may take a while.