Open Access
Fig. 3.
Download original image
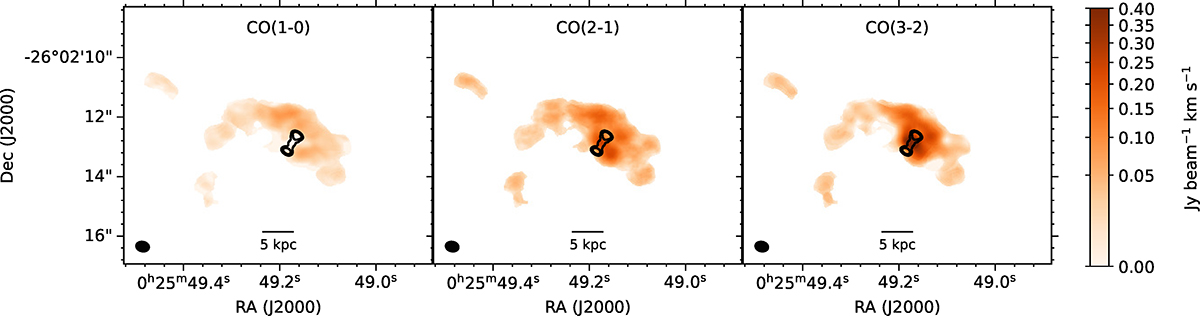
Total intensity images of the three transitions on the same flux scale (Jy beam−1 km s−1). These images were made from data cubes convolved to the same resolution of 0![]() 45 × 0
45 × 0![]() 34 (2.1 × 1.6 kpc; see Sect. 2). In all three panels, the 87-GHz continuum is overplotted with contour levels at 1 and 9 mJy beam−1.
34 (2.1 × 1.6 kpc; see Sect. 2). In all three panels, the 87-GHz continuum is overplotted with contour levels at 1 and 9 mJy beam−1.
Current usage metrics show cumulative count of Article Views (full-text article views including HTML views, PDF and ePub downloads, according to the available data) and Abstracts Views on Vision4Press platform.
Data correspond to usage on the plateform after 2015. The current usage metrics is available 48-96 hours after online publication and is updated daily on week days.
Initial download of the metrics may take a while.