Fig. 7.
Download original image
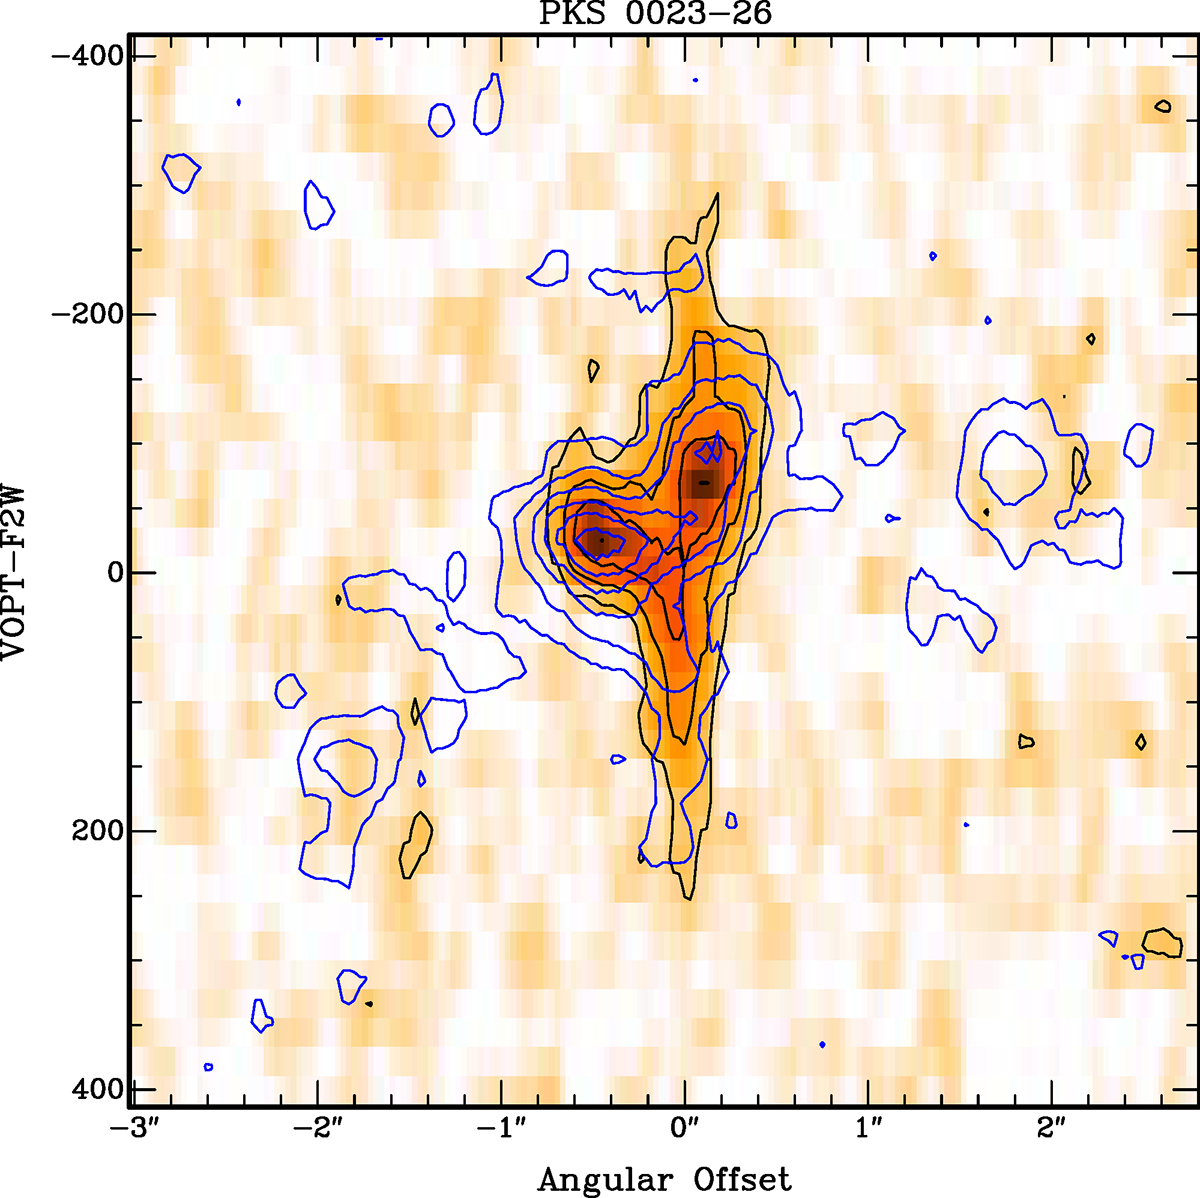
Position-velocity plot of the CO(3-2) emission (grey scale) obtained from a cut centered at the core and perpendicular to the radio axis (PA = 51°). The plot shows the large velocity width (FWZI ∼ 600 km s−1) of the gas in the central regions. The contour levels are at 0.36, 0.72, and 1.08 mJy beam−1. The CO(2-1) emission along the same position angle (blue contours, levels at 0.24 and 0.48 mJy beam−1) shows the same broad emission in the centre, but also the overall velocity gradient in this direction.
Current usage metrics show cumulative count of Article Views (full-text article views including HTML views, PDF and ePub downloads, according to the available data) and Abstracts Views on Vision4Press platform.
Data correspond to usage on the plateform after 2015. The current usage metrics is available 48-96 hours after online publication and is updated daily on week days.
Initial download of the metrics may take a while.