Fig. 3
Download original image
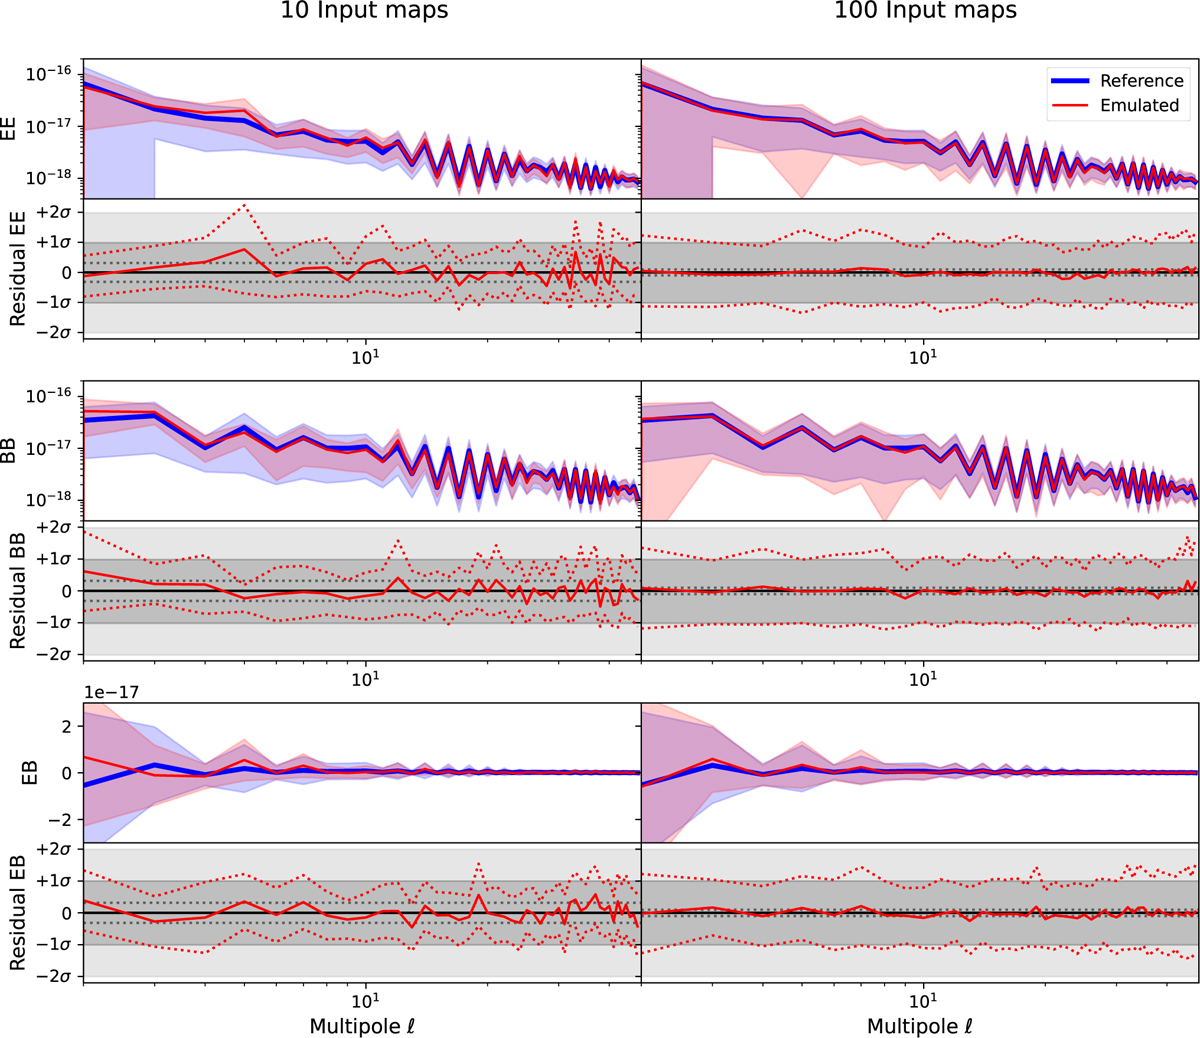
Comparison of the EE, BB, and EB angular power spectra for the emulated maps (red) versus the reference dataset (blue), shown for the Ninput = 10 (left) and Ninput = 100 (right) cases. In each row, the top panel displays the average power spectra with 1 σ shading, while the bottom panel shows the residual, ![]() (solid red) along with
(solid red) along with ![]() (dotted red), where
(dotted red), where ![]() is the standard deviation from the reference set and
is the standard deviation from the reference set and ![]() is the emulated dataset's one. In both the 10-map and 100-map cases, the mean spectra and variance per multipole closely match those of the reference set, and the residuals lie well within the 1σ band. The bottom panels also show in dotted gray the standard error on the mean for a sample of size Ninput, that is
is the emulated dataset's one. In both the 10-map and 100-map cases, the mean spectra and variance per multipole closely match those of the reference set, and the residuals lie well within the 1σ band. The bottom panels also show in dotted gray the standard error on the mean for a sample of size Ninput, that is ![]() , with Ninput = 10(100) in the left (right) plots. Notably, the scatter of the mean residual is roughly within this band in both cases, indicating the success of the augmentation process. See Section 5.3 for further details.
, with Ninput = 10(100) in the left (right) plots. Notably, the scatter of the mean residual is roughly within this band in both cases, indicating the success of the augmentation process. See Section 5.3 for further details.
Current usage metrics show cumulative count of Article Views (full-text article views including HTML views, PDF and ePub downloads, according to the available data) and Abstracts Views on Vision4Press platform.
Data correspond to usage on the plateform after 2015. The current usage metrics is available 48-96 hours after online publication and is updated daily on week days.
Initial download of the metrics may take a while.