Fig. 4
Download original image
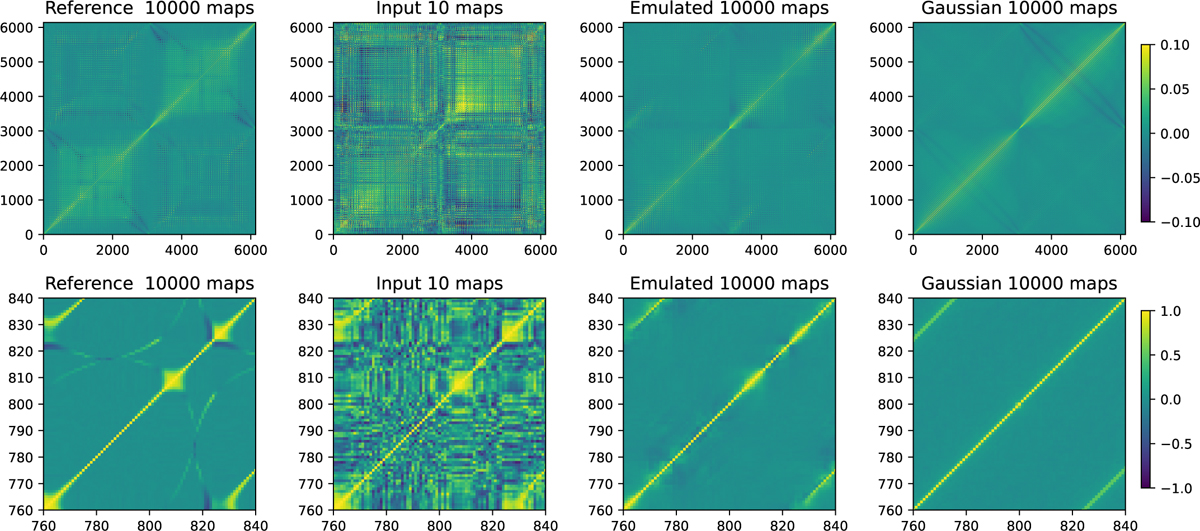
Upper panel: empirical pixel correlation matrices estimated from the reference dataset, the input dataset, the emulated dataset, and the Gaussian dataset in the Ninput = 10 case. The color scale runs between −0.1 and 0.1 to highlight the structures and allow for a visual comparison. See Section 5 for details. Bottom panels: zoom-in between pixel 760–840 of the corresponding covariance matrix in the upper panel. Note that here the color scale runs between −1 and 1. See Section 5.3 for further details.
Current usage metrics show cumulative count of Article Views (full-text article views including HTML views, PDF and ePub downloads, according to the available data) and Abstracts Views on Vision4Press platform.
Data correspond to usage on the plateform after 2015. The current usage metrics is available 48-96 hours after online publication and is updated daily on week days.
Initial download of the metrics may take a while.