Open Access
Fig. 6
Download original image
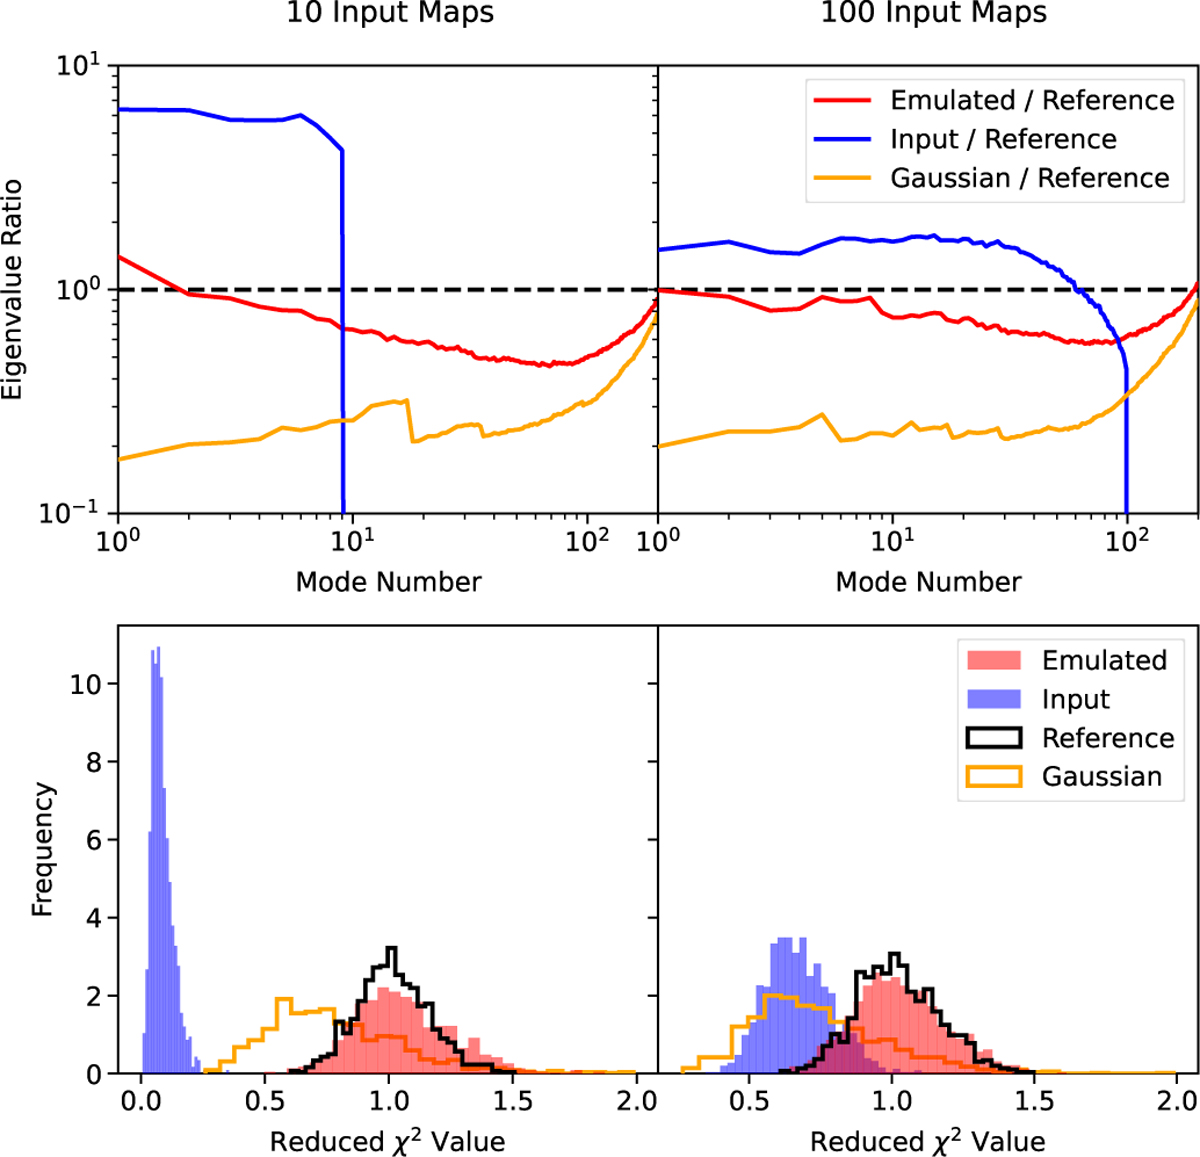
Top panel: ratio of eigenvalues of the input, emulated, and Gaussian pixel covariance matrices in Fig. 4 to the reference covariance's ones. Bottom panel: histograms of chi-square values computed using 1000 maps from the reference dataset and the four different covariance matrices. See Section 5.3 for details.
Current usage metrics show cumulative count of Article Views (full-text article views including HTML views, PDF and ePub downloads, according to the available data) and Abstracts Views on Vision4Press platform.
Data correspond to usage on the plateform after 2015. The current usage metrics is available 48-96 hours after online publication and is updated daily on week days.
Initial download of the metrics may take a while.