Fig. A.1
Download original image
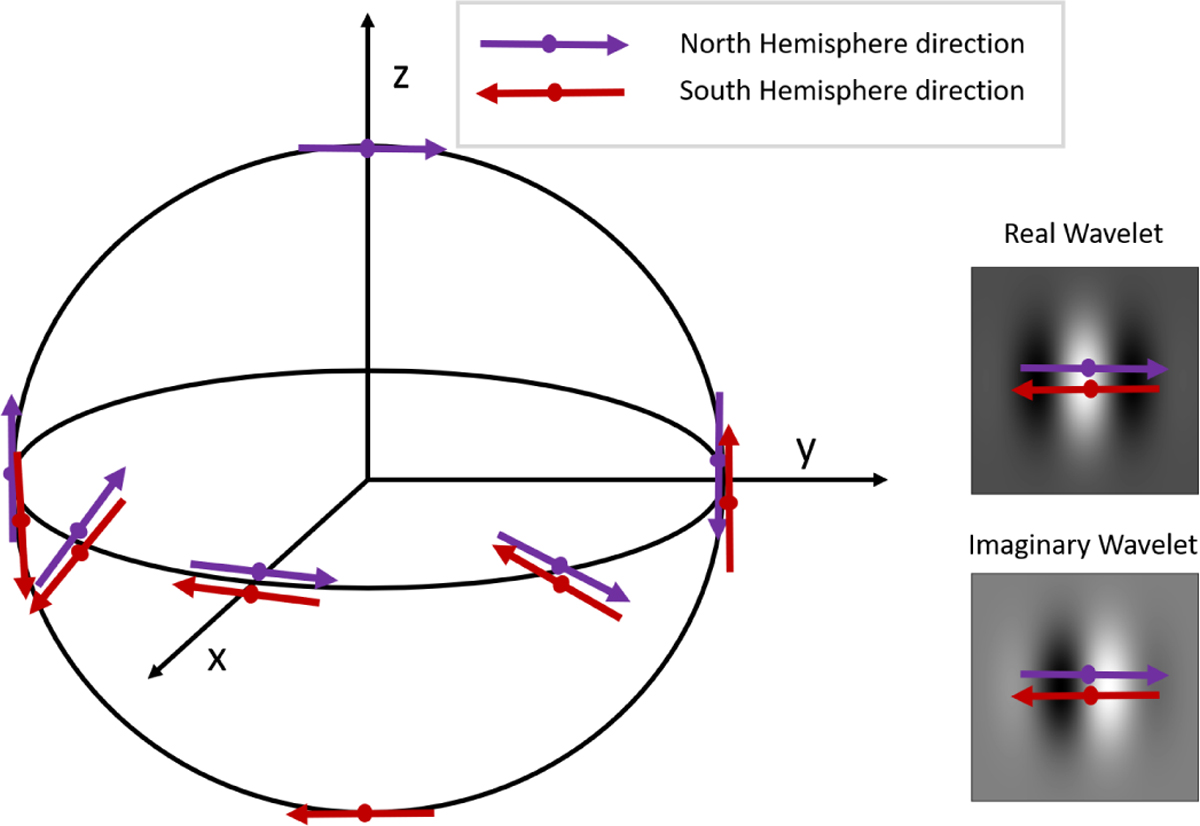
Explanation of the local rotational frame utilized to represent the wavelet coefficients. An inversion of direction occurs between the northern (depicted by the blue arrow) and southern (depicted by the red arrow) hemispheres. The effect of this directional inversion is shown in both the real part (top right panel) and the imaginary part (bottom right panel).
Current usage metrics show cumulative count of Article Views (full-text article views including HTML views, PDF and ePub downloads, according to the available data) and Abstracts Views on Vision4Press platform.
Data correspond to usage on the plateform after 2015. The current usage metrics is available 48-96 hours after online publication and is updated daily on week days.
Initial download of the metrics may take a while.