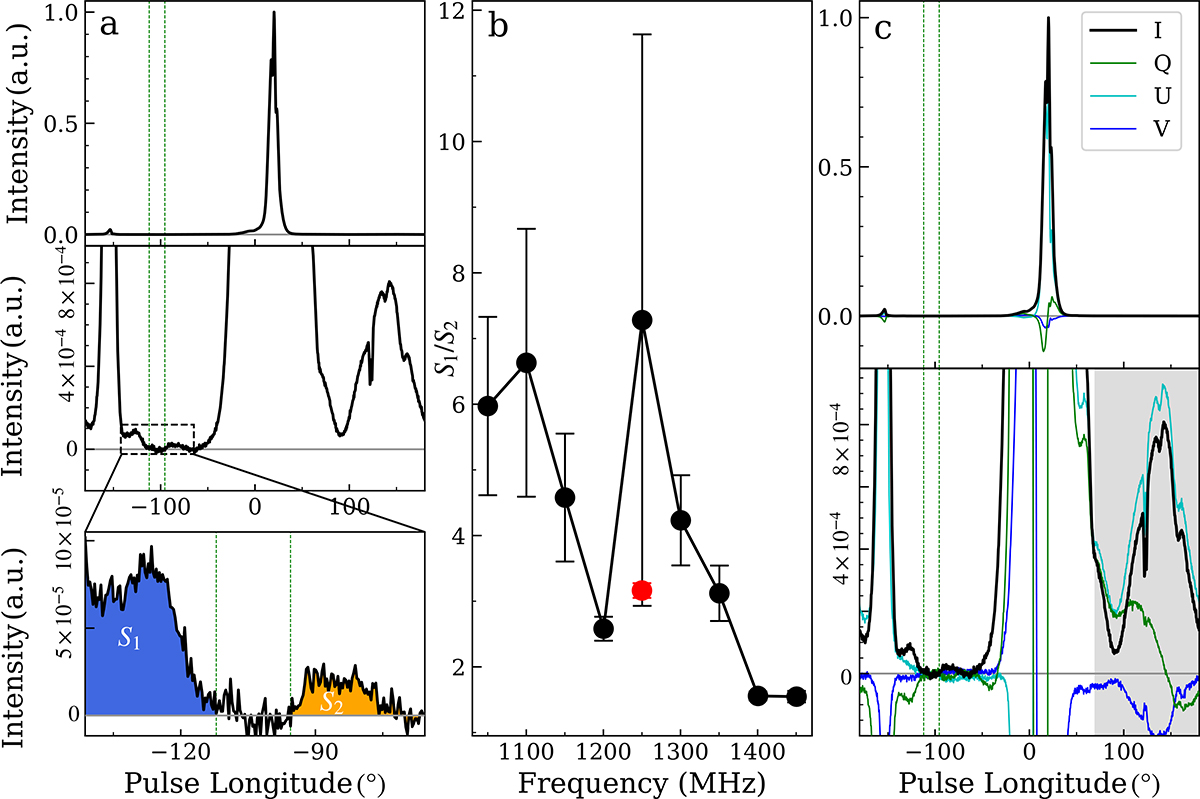
Fig. 1.
Download original image
Radio emission feature of PSR B1929+10. (a) The averaged pulse profile is included in the top panel, and the corresponding ×1000 expanded scale view is plotted in the middle panel. To unravel the profile longitudes with extremely weak emission at the pulse longitude range −150° to −70° even further, a detailed view of the rectangle region in the dashed-dotted box is shown in the bottom panel. The labeled S1 and S2 correspond to the areas of the first and second new pulse components in the left (blue region) and the right (orange region), respectively. The region between the two vertical green dashed lines is believed to be the baseline position, and the solid gray line represents the baseline position. The pulse profile has been normalized by the peak radio emission of the average pulse. (b) To identify whether the two new pulse components are still visible, which are similar to the results shown in the bottom panel (a) at nine narrow bands, we calculate the ratio between the S1 and S2, S1/S2, at nine narrow bands and plot them in this subpanel. The red dot corresponds to the ratio S1/S2 for the two new pulse components of the average pulse profile. (c) The observed profiles of Stokes parameters for PSR B1929+10 based on the conventional baseline subtraction. We plot the total intensity (the Stokes I in the black), the Stokes Q in the green, the Stokes U in the cyan, and the circular polarization intensity (the Stokes V in the blue) in the top panel. To reveal the observed profiles in the weak emission region in more detail, the ×1000 expanded scale view is included in the bottom panel. The vertical axis is the same as the vertical axis of panel (a). Same as panel (a), the region between the two vertical green dashed lines is believed to be the baseline position and is then subtracted. The horizontal gray line represents the baseline position. And the vertical gray shadow shows that an unphysical phenomenon is that the Stokes U is greater than the total intensity Stokes I, due to the conventional baseline subtraction, which is not suitable for this pulsar. See the main text for further details about the plots.
Current usage metrics show cumulative count of Article Views (full-text article views including HTML views, PDF and ePub downloads, according to the available data) and Abstracts Views on Vision4Press platform.
Data correspond to usage on the plateform after 2015. The current usage metrics is available 48-96 hours after online publication and is updated daily on week days.
Initial download of the metrics may take a while.