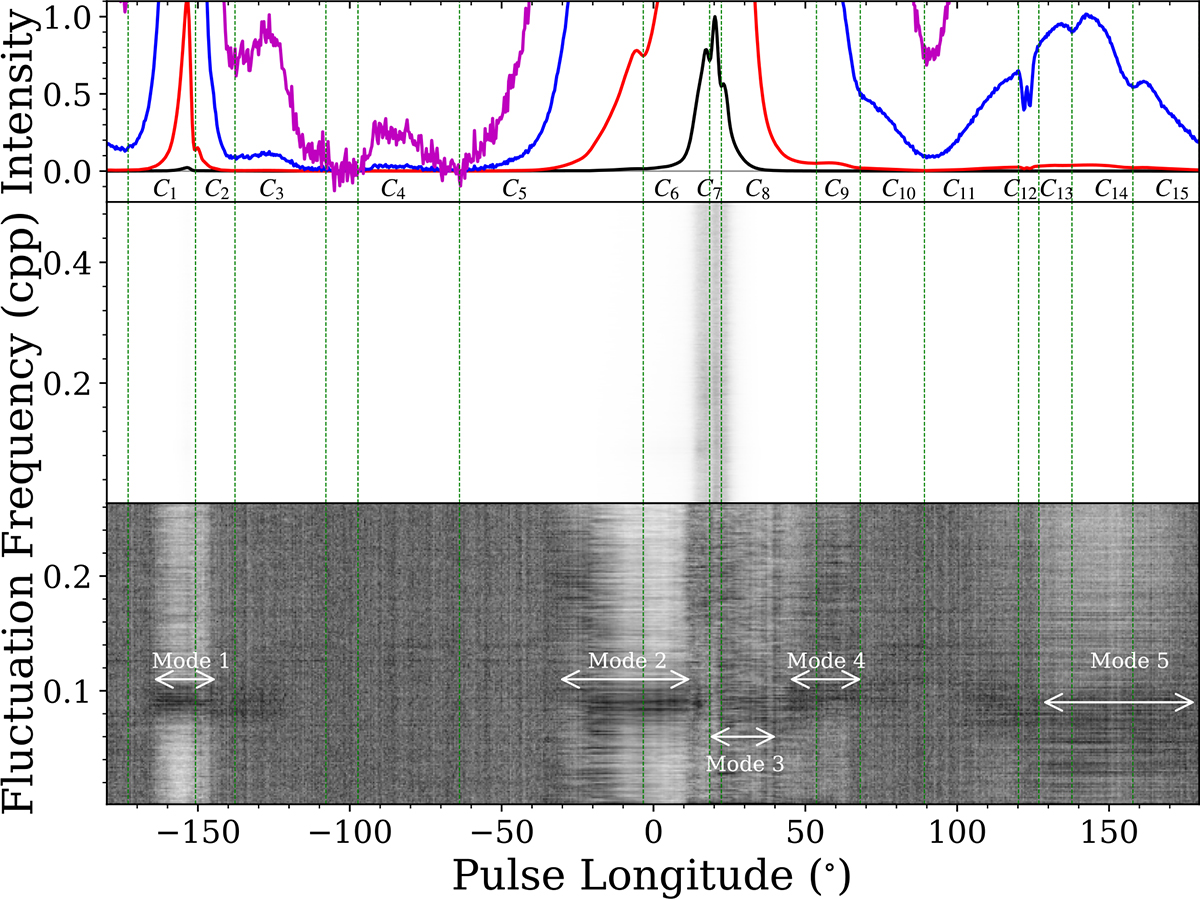
Fig. 2.
Download original image
Observed pulse profile and the LRFS for PSR B1929+10. The top panel depicts the average pulse profile over about 17 000 individual pulses; the intensity is scaled with the peak radio emission. The black curve shows the average pulse profile. To visualize the different pulse emission components, the 50× scaled zoom view is presented as the red curve, while the blue and magenta curves represent the 1250× and 10 000× scaled zoom views, respectively. The intensity is measured in units of arbitrary units. The LRFS is calculated and plotted in the middle panel. To show the characteristics of the pulse component in the LRFS and then identify them, we reanalyze the LRFS and utilize the peak value of the LRFS in each pulse longitude to normalize them, respectively. The result is included in the bottom panel, and the arrows indicate the pulse longitude ranges of these modes.
Current usage metrics show cumulative count of Article Views (full-text article views including HTML views, PDF and ePub downloads, according to the available data) and Abstracts Views on Vision4Press platform.
Data correspond to usage on the plateform after 2015. The current usage metrics is available 48-96 hours after online publication and is updated daily on week days.
Initial download of the metrics may take a while.