Fig. 3.
Download original image
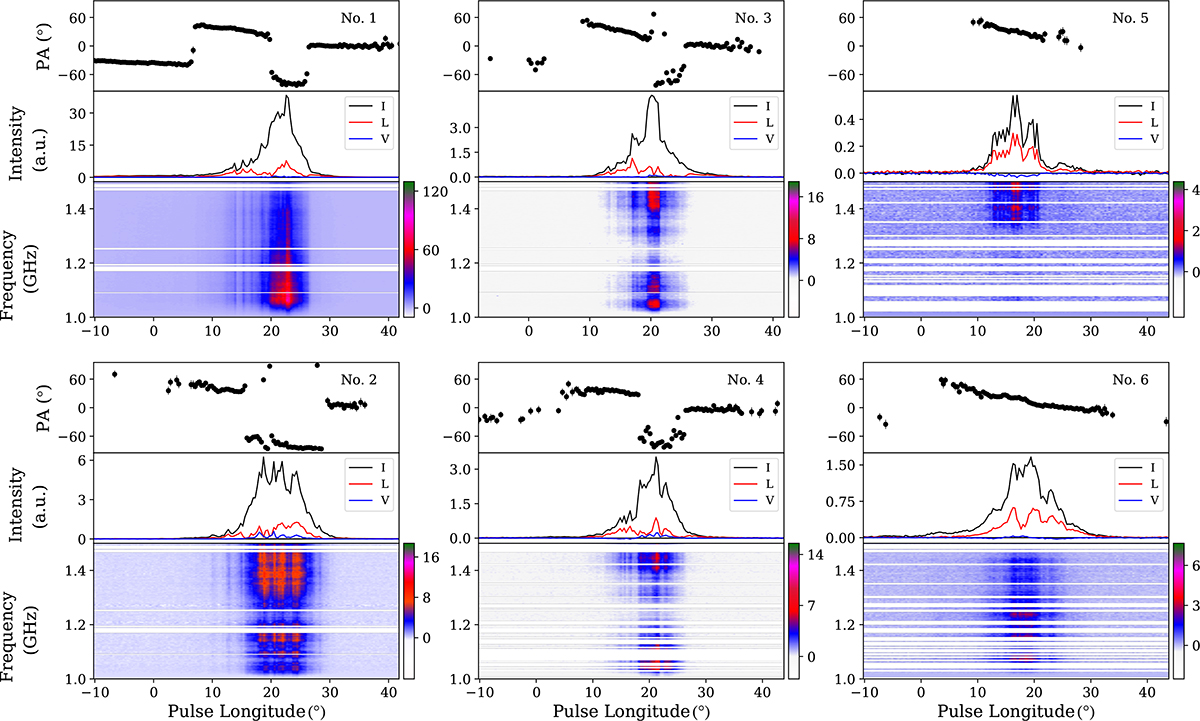
Narrowband emission feature of the selected samples of the single pulses. For each single pulse, the observed PPAs are included in the top panel, and the profile of the total intensity (Stokes I in the black), the linear polarization intensity (![]() in the red), and the circular polarization intensity (Stokes V in the blue) are plotted in the middle panel. To investigate the emission feature of the pulse window in a single pulse further, we plot the dynamic spectra of the flux density as a function of frequency and pulse longitude in the bottom panel. The color bar represents the flux density and is measured in arbitrary units. The horizontal white lines denote the RFI frequency channels and are set to zero. The white areas indicate the noise floor. We chose the errors in the observed PPAs lower than 5° in each single pulse to limit the random error due to the system noise.
in the red), and the circular polarization intensity (Stokes V in the blue) are plotted in the middle panel. To investigate the emission feature of the pulse window in a single pulse further, we plot the dynamic spectra of the flux density as a function of frequency and pulse longitude in the bottom panel. The color bar represents the flux density and is measured in arbitrary units. The horizontal white lines denote the RFI frequency channels and are set to zero. The white areas indicate the noise floor. We chose the errors in the observed PPAs lower than 5° in each single pulse to limit the random error due to the system noise.
Current usage metrics show cumulative count of Article Views (full-text article views including HTML views, PDF and ePub downloads, according to the available data) and Abstracts Views on Vision4Press platform.
Data correspond to usage on the plateform after 2015. The current usage metrics is available 48-96 hours after online publication and is updated daily on week days.
Initial download of the metrics may take a while.