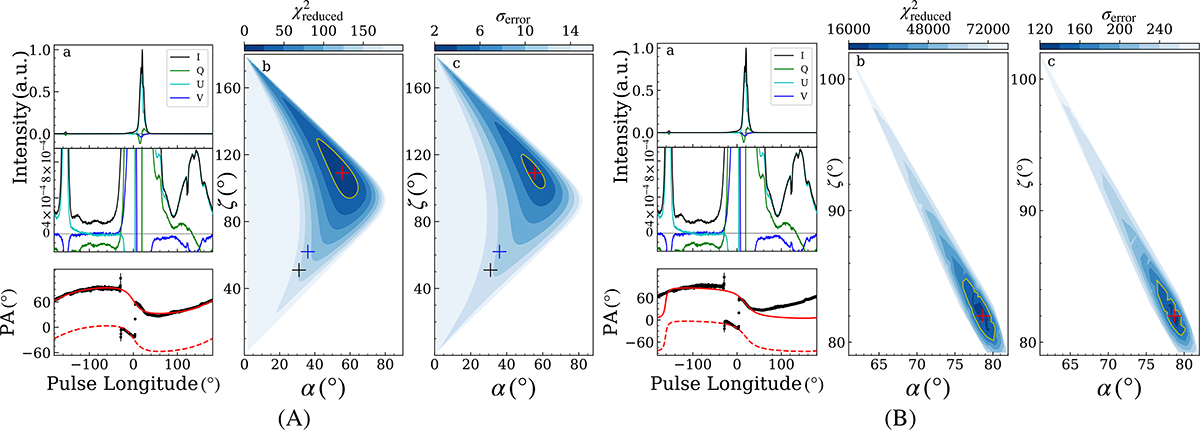
Fig. 4.
Download original image
Polarization profiles and the solution of the RVM for the observed PPAs of the average pulse for PSR B1929+10. In the top (a) panel of the (A) panels, we plot the profiles of the total intensity (the Stokes I, in the black); the Stokes Q, in the green; the Stokes U, in the cyan; and the circular polarization intensity (the Stokes V, in the blue) in the top panel. The corresponding ×1000 expanded scale view is included in the middle (a) panel. The horizontal gray line denotes the baseline position in the top and middle panels. The observed PPAs are in black dots and are plotted in the bottom (a) panel. The red curve obtained from the best model fit and its 90° offsets are in the dashed red curve. Panel (b) depicts the α − ζ plane, which shows the χreduced2 from the fitting routine. The ζ is the viewing angle, which corresponds to the angle between the line of sight and the rotation axis. The best RVM solution is included, which is in the red cross, denoting the location of the minimum χreduced2 in the α − ζ surface. We plot the standard deviation, σerror, of the errors between the observed PPAs and the model curve as a function of the α and ζ in panel (c), which is obtained from the fitting routine. The red cross corresponds to the location of the best RVM solution. For the best RVM model fit, the inclination angle, α, and the viewing angle, ζ, of this pulsar are 55°.62, and 109°.09, respectively. To compare with previous works of the polarization measurements for this pulsar, we plot the result of α = 36° and ζ = 62° in the blue cross reported by Everett & Weisberg (2001). While the black cross corresponds to the result of α = 31° and ζ = 51° given by Phillips (1990). See the main text for further discussion about the polarization measurement. The solid yellow contour line corresponds to the 95 percent confidence regions. The (B) panels are the same as those of (A), but the errors of the PPAs have been considered when using the RVM to fit the observed PPAs over the full longitude. The best model fit indicates that the value of α, the value of ζ, and the steepest gradient of the RVM, ϕ0, are 78°.70, 82°.0, and 18° .40, respectively.
Current usage metrics show cumulative count of Article Views (full-text article views including HTML views, PDF and ePub downloads, according to the available data) and Abstracts Views on Vision4Press platform.
Data correspond to usage on the plateform after 2015. The current usage metrics is available 48-96 hours after online publication and is updated daily on week days.
Initial download of the metrics may take a while.