Fig. 5.
Download original image
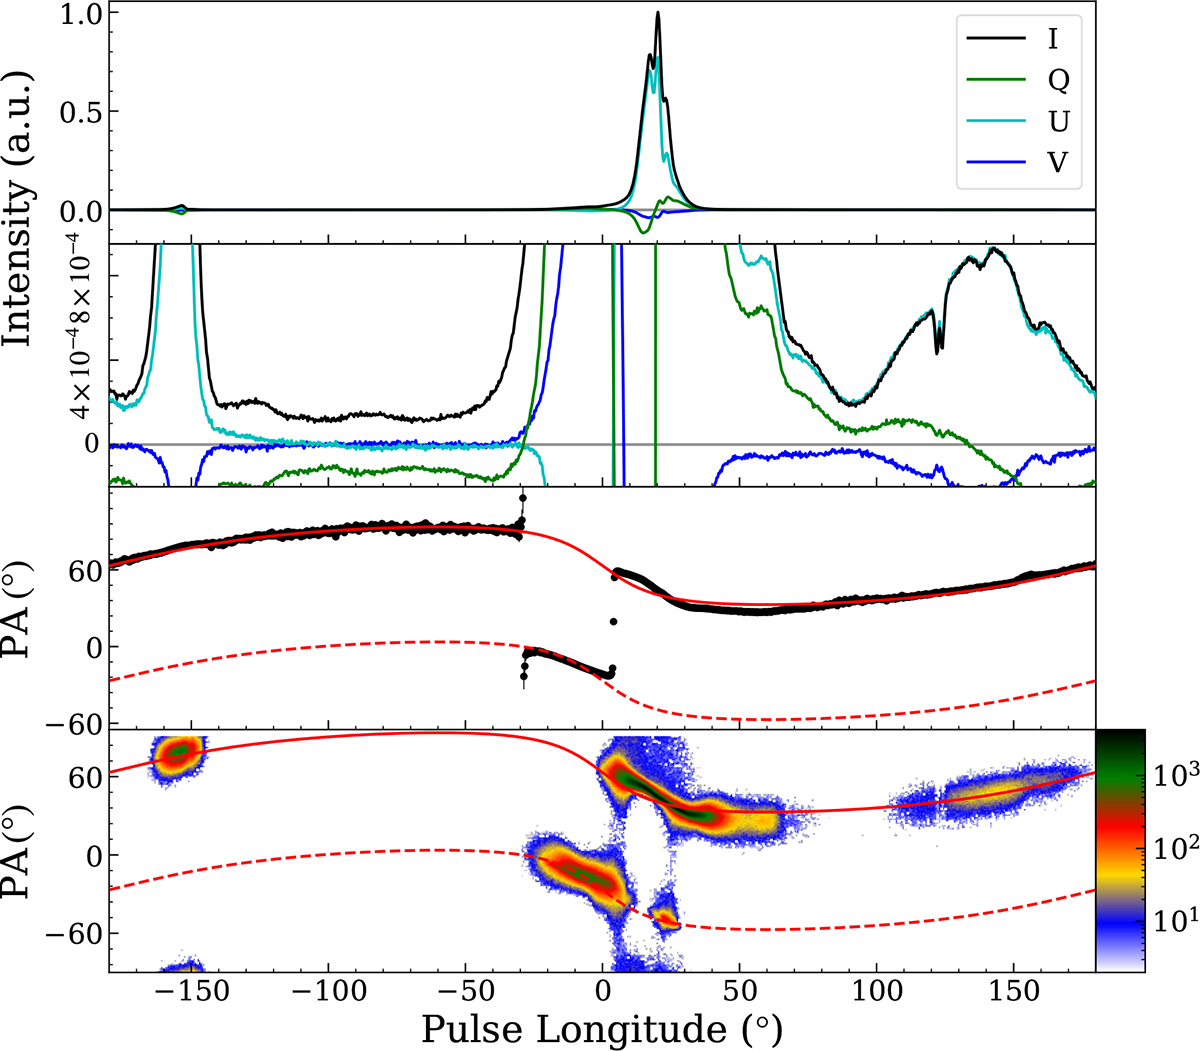
Polarization emission features for PSR B1929+10. We plot the total intensity (Stokes I), the Stokes Q, the Stokes U, and the circular polarization intensity (Stokes V) in the top panel. To unravel the features of intrinsic radio emission in the profile longitudes with extremely weak emission and the full longitude, the corresponding ×1000 expanded scale view is included in the second row panel. The profiles of all Stokes parameters have been scaled with the peak intensity of the Stokes I. The observed PPAs (black dots) are included in the third-row panel. The best-fitting RVM is in the solid red curve, and its 90° offsets are in the dashed red curve. We adjust the steepest gradient of the RVM solution ϕ0 to the reference 0° of longitude. To reveal the different polarization modes that contribute to the polarization emission feature of this pulsar in different emission regions, we plot the observed PPAs of the single pulse in the bottom panel. The number of individual pulses is indicated by the color bar in the log-scale coordinate view. We have chosen the error bars for the observed PPA that are less than 5° for each single pulse. Although such a high threshold reduces the counts and selects against the extremely weak emission pulses, this threshold allowed us to distinguish the intrinsic radio emission of the distribution from emission introduced by the system noise. The solid and dashed red curves are the same as the third-row panel.
Current usage metrics show cumulative count of Article Views (full-text article views including HTML views, PDF and ePub downloads, according to the available data) and Abstracts Views on Vision4Press platform.
Data correspond to usage on the plateform after 2015. The current usage metrics is available 48-96 hours after online publication and is updated daily on week days.
Initial download of the metrics may take a while.