Open Access
Fig. 3
Download original image
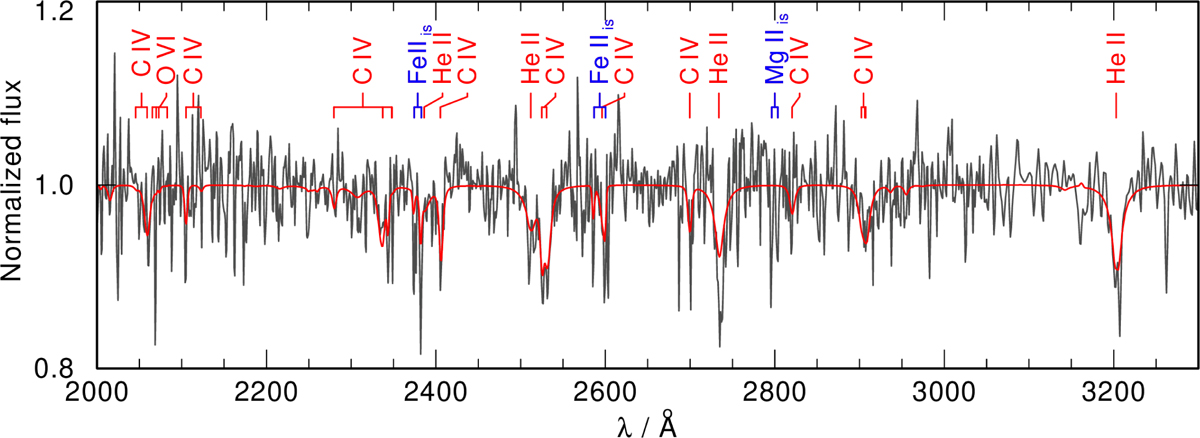
Important parts of the low-resolution STIS spectrum, with our best-fit model (in red; 175 000 K and log g = 7.7; other parameters are listed in Table 2). The interstellar lines are marked in blue.
Current usage metrics show cumulative count of Article Views (full-text article views including HTML views, PDF and ePub downloads, according to the available data) and Abstracts Views on Vision4Press platform.
Data correspond to usage on the plateform after 2015. The current usage metrics is available 48-96 hours after online publication and is updated daily on week days.
Initial download of the metrics may take a while.