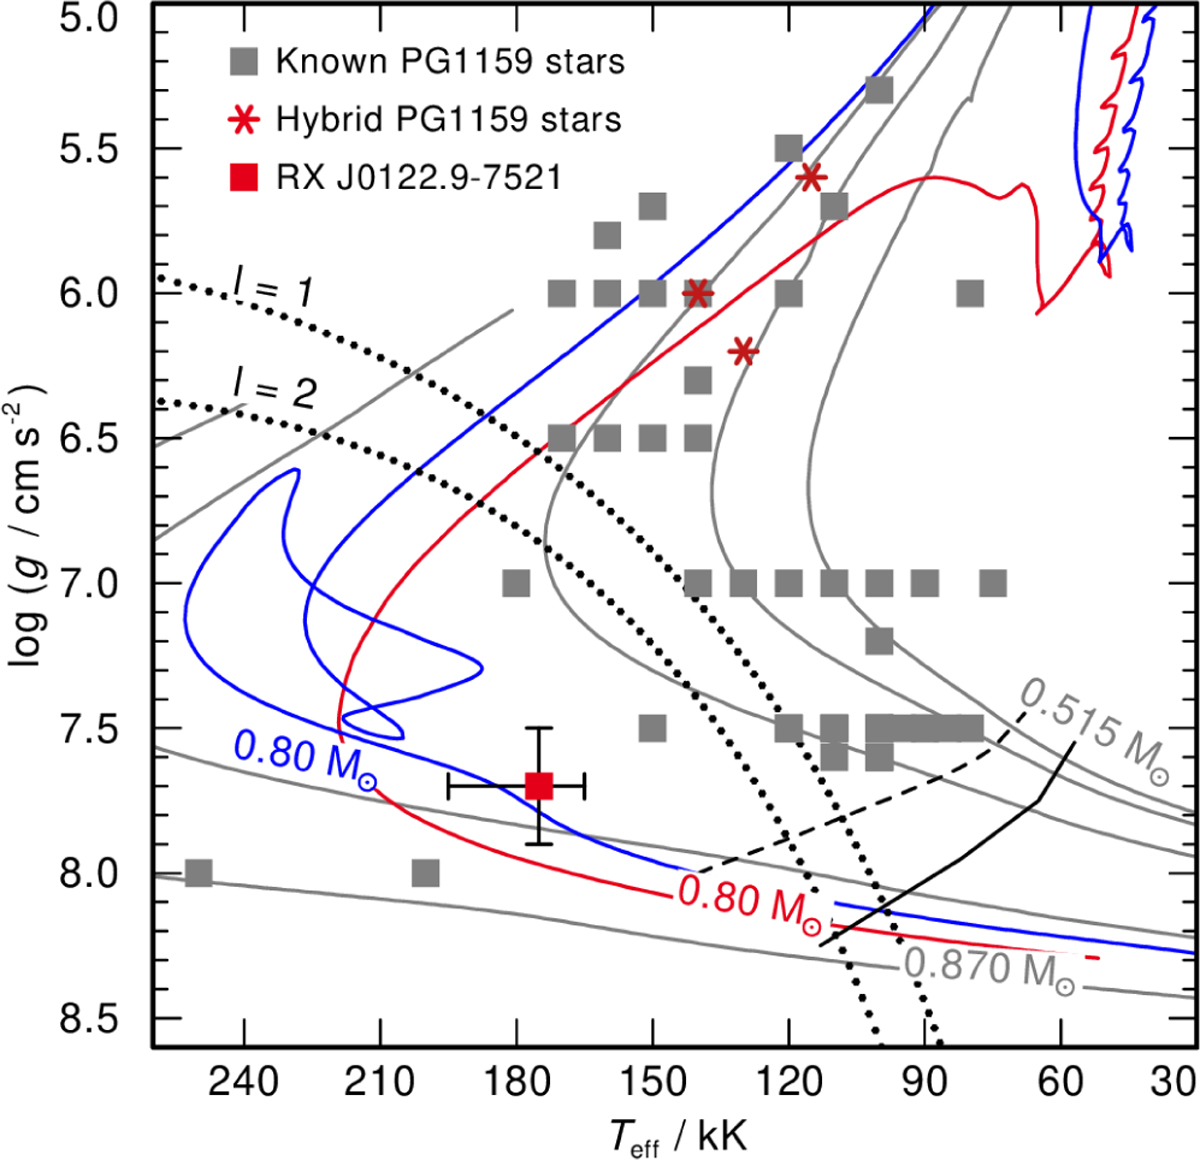
Fig. 4
Download original image
Position of RX J0122.9–7521 on the log g-Teff diagram, along with the other known PG 1159 stars. VLTP evolutionary tracks from Althaus et al. (2009) are depicted in grey and represent masses of 0.515, 0.530, 0.584, 0.741, and 0.870 M⊙. The red track represents the potential evolutionary path of a merger product of a 0.45 M⊙ helium-core white dwarf and a 0.35 M⊙ carbon-oxygen-core white dwarf and was calculated by Miller Bertolami et al. (2022). The blue line represents the merger of two He white dwarfs with a total mass of 0.8 M⊙ (Zhang & Jeffery 2012). The solid black line shows the wind limit, and the dashed black line shows the wind limit when the mass-loss rate is reduced by a factor of 10 (Unglaub & Bues 2000). The blue edges of instability are indicated by the two dotted black lines, corresponding to the unstable g-modes l=1 and l=2, respectively (Córsico et al. 2006).
Current usage metrics show cumulative count of Article Views (full-text article views including HTML views, PDF and ePub downloads, according to the available data) and Abstracts Views on Vision4Press platform.
Data correspond to usage on the plateform after 2015. The current usage metrics is available 48-96 hours after online publication and is updated daily on week days.
Initial download of the metrics may take a while.