Fig. 5
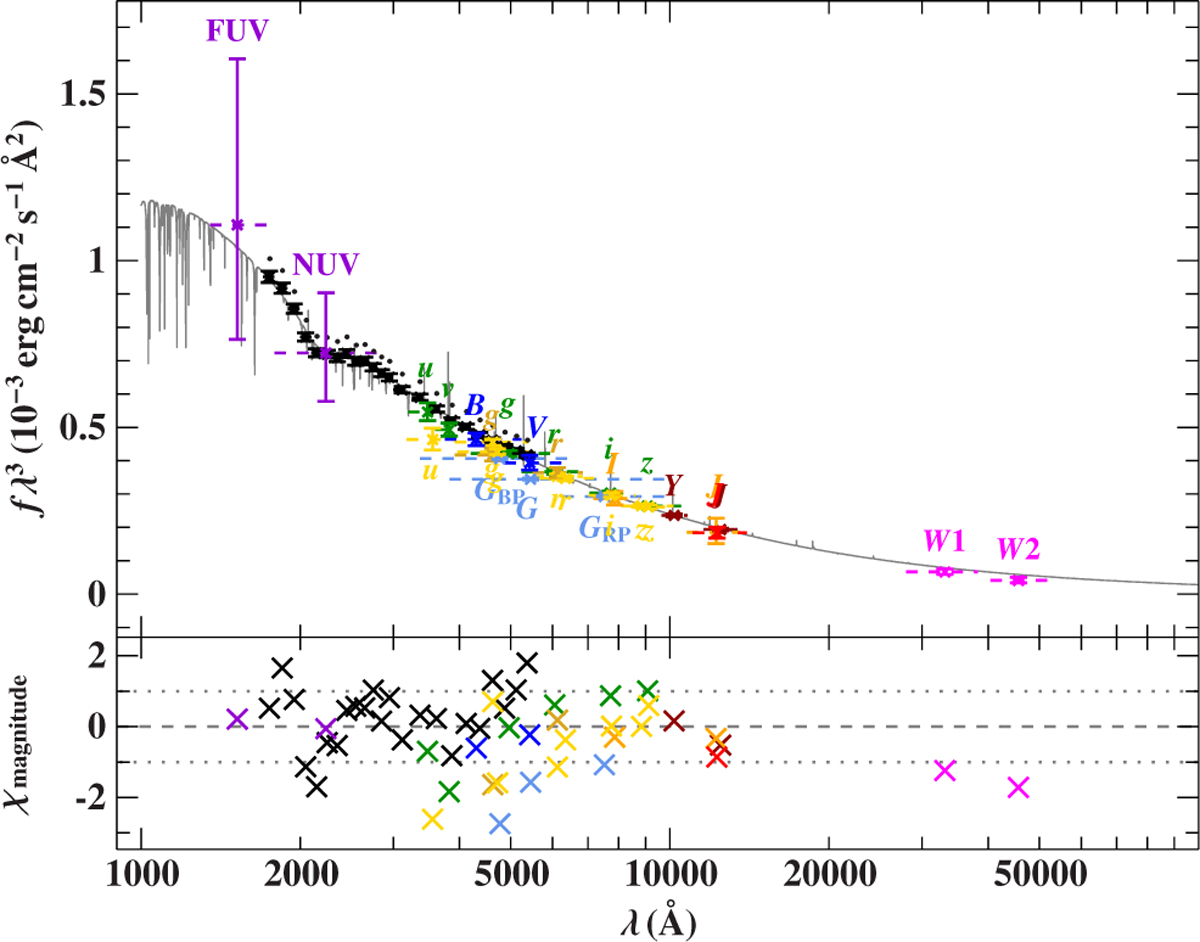
Download original image
Fluxes averaged over filters, based on observed magnitudes, shown in different colours. Dashed horizontal lines indicate the full width at the tenth maximum for each filter passband, with the grey line representing the best-fitting model. Lower part: uncertainty-weighted residuals. The colour coding for the various photometric systems is as follows: GALEX in violet (Bianchi et al. 2017), 2MASS in red (Skrutskie et al. 2006), DELVE DR2 in yellow (Drlica-Wagner et al. 2022), DENIS in orange (Epchtein et al. 1994), Gaia in light blue (Gaia Collaboration 2021), Johnson in blue (Henden et al. 2015), SDSS in gold (Alam et al. 2015), SMASH in yellow (Nidever et al. 2017), Skymapper in green (Wolf et al. 2018), VISTA in maroon (McMahon et al. 2013), WISE in magenta (Schlafly et al. 2019), and in black the STIS spectra G230LB | G430L | G750L with the box filters: [1000–3000 Å, step 100 Å], [3000–4500 Å, step 250 Å], and [4500–5500 Å, step 250 Å].
Current usage metrics show cumulative count of Article Views (full-text article views including HTML views, PDF and ePub downloads, according to the available data) and Abstracts Views on Vision4Press platform.
Data correspond to usage on the plateform after 2015. The current usage metrics is available 48-96 hours after online publication and is updated daily on week days.
Initial download of the metrics may take a while.