Fig. 1
Download original image
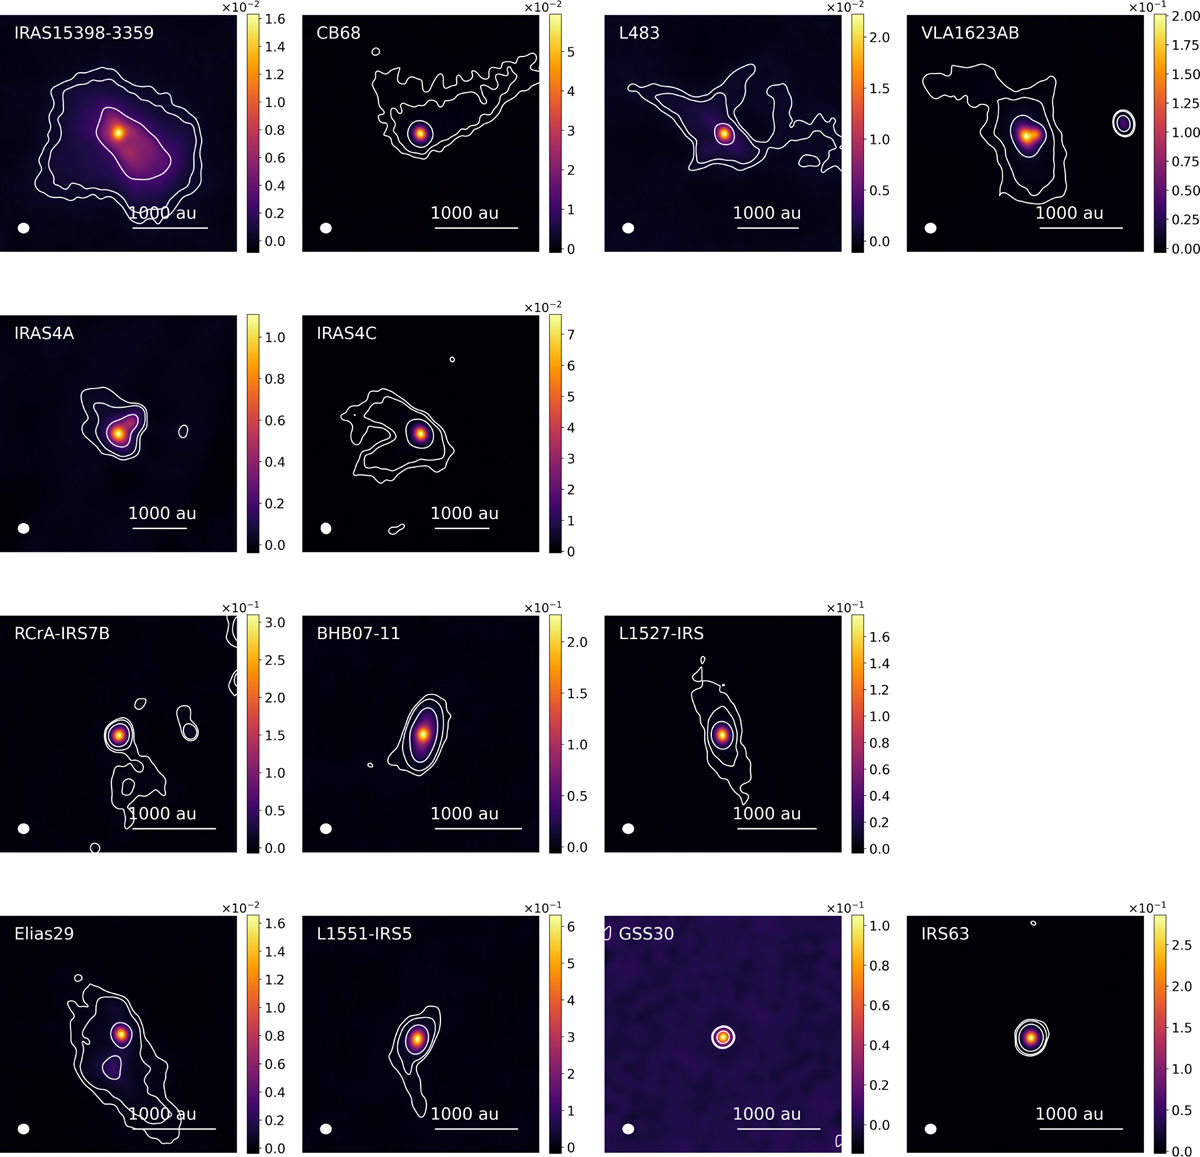
Dust continuum emission of the ALMA FAUST large program sample at 1.2 mm. The color bar is in units of Jy/beam. The synthesised beam is depicted in the lower left corner as a white ellipse and is reported, along with the rms of each map, in Table A.1. The white contours are at levels of [5, 10, 50] σ. The panels are centred on the source and cover 20 arcsec across. The first two rows show class 0 sources, the third row shows class 0/I sources, and the last row shows class I sources (Table 1).
Current usage metrics show cumulative count of Article Views (full-text article views including HTML views, PDF and ePub downloads, according to the available data) and Abstracts Views on Vision4Press platform.
Data correspond to usage on the plateform after 2015. The current usage metrics is available 48-96 hours after online publication and is updated daily on week days.
Initial download of the metrics may take a while.