Fig. 2
Download original image
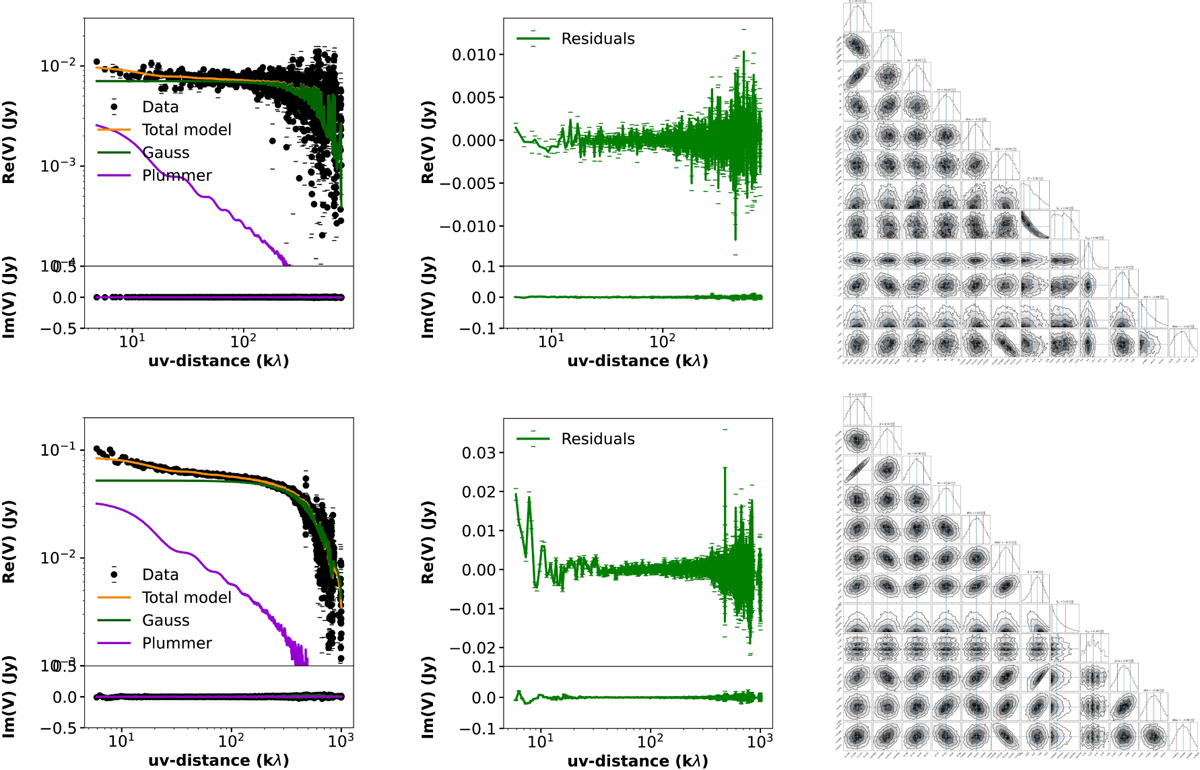
Plummer plus Gaussian best fit (orange) overplotted on the real and imaginary parts of the visibilities for the B3 (upper panel, black points) and B6 (lower panel) observations of CB68. The Plummer only (violet line) and Gaussian only (green line) components of the total model are also shown. The wiggles in the model are due to its sampling on the uv-points of the observations. The residuals of the model are shown in green at the side of each plot. The corner plots are shown for completeness and the parameters values reported in Table 2 for readability.
Current usage metrics show cumulative count of Article Views (full-text article views including HTML views, PDF and ePub downloads, according to the available data) and Abstracts Views on Vision4Press platform.
Data correspond to usage on the plateform after 2015. The current usage metrics is available 48-96 hours after online publication and is updated daily on week days.
Initial download of the metrics may take a while.