Fig. C.1
Download original image
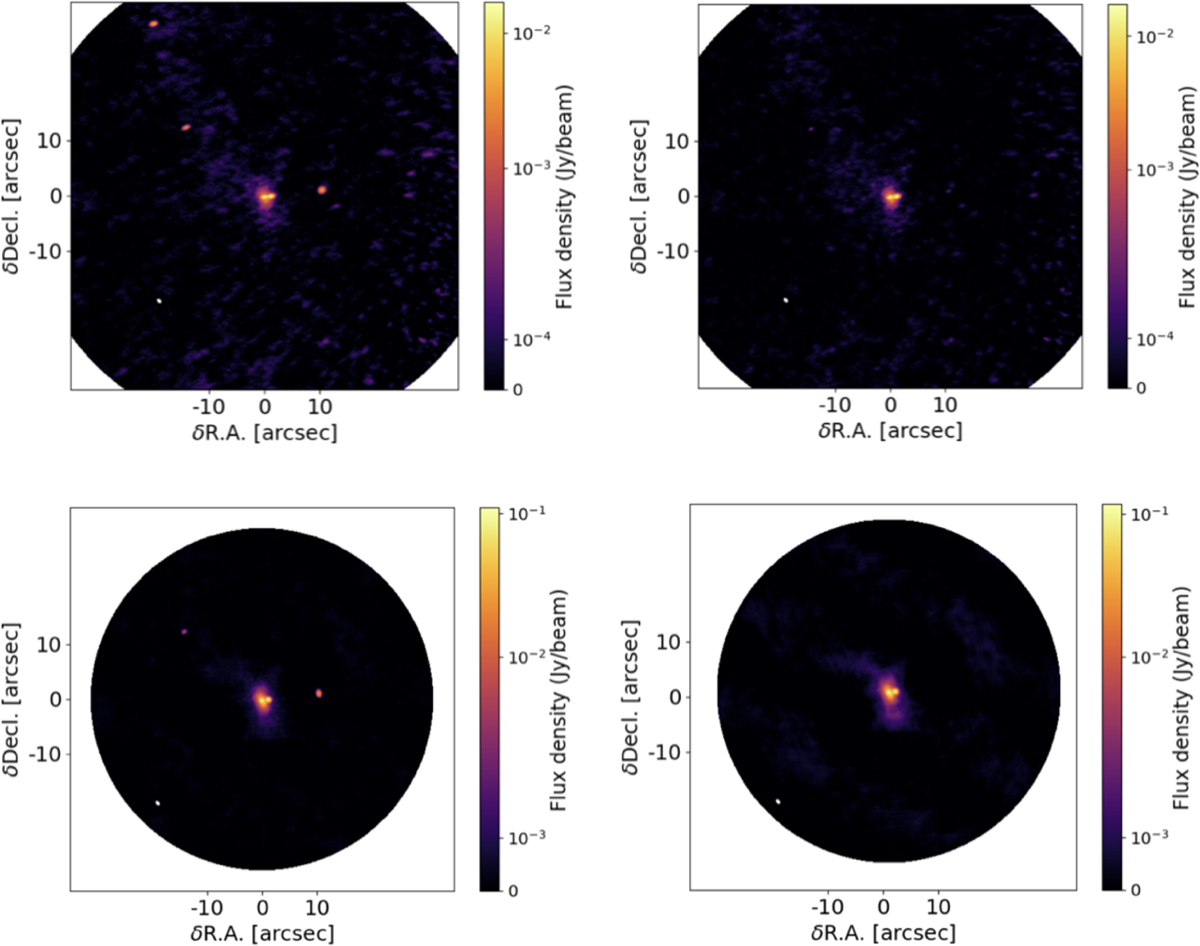
Upper panel: B3 data for VLA1623A before (left) and after subtraction of the three secondary sources in the field of view (right). Lower panel: same as upper panel, but for B6 data and for the only two sources seen in the smaller field of view. The color scale is preserved for fair comparison. The beam is shown as a white ellipse in the lower left corners. The remaining data was modelled with two gaussians for the disks of VLA1623 A and B, and a Plummer envelope centred on VLA1623A. See Fig. 1 for a zoom-in.
Current usage metrics show cumulative count of Article Views (full-text article views including HTML views, PDF and ePub downloads, according to the available data) and Abstracts Views on Vision4Press platform.
Data correspond to usage on the plateform after 2015. The current usage metrics is available 48-96 hours after online publication and is updated daily on week days.
Initial download of the metrics may take a while.