Fig. 3
Download original image
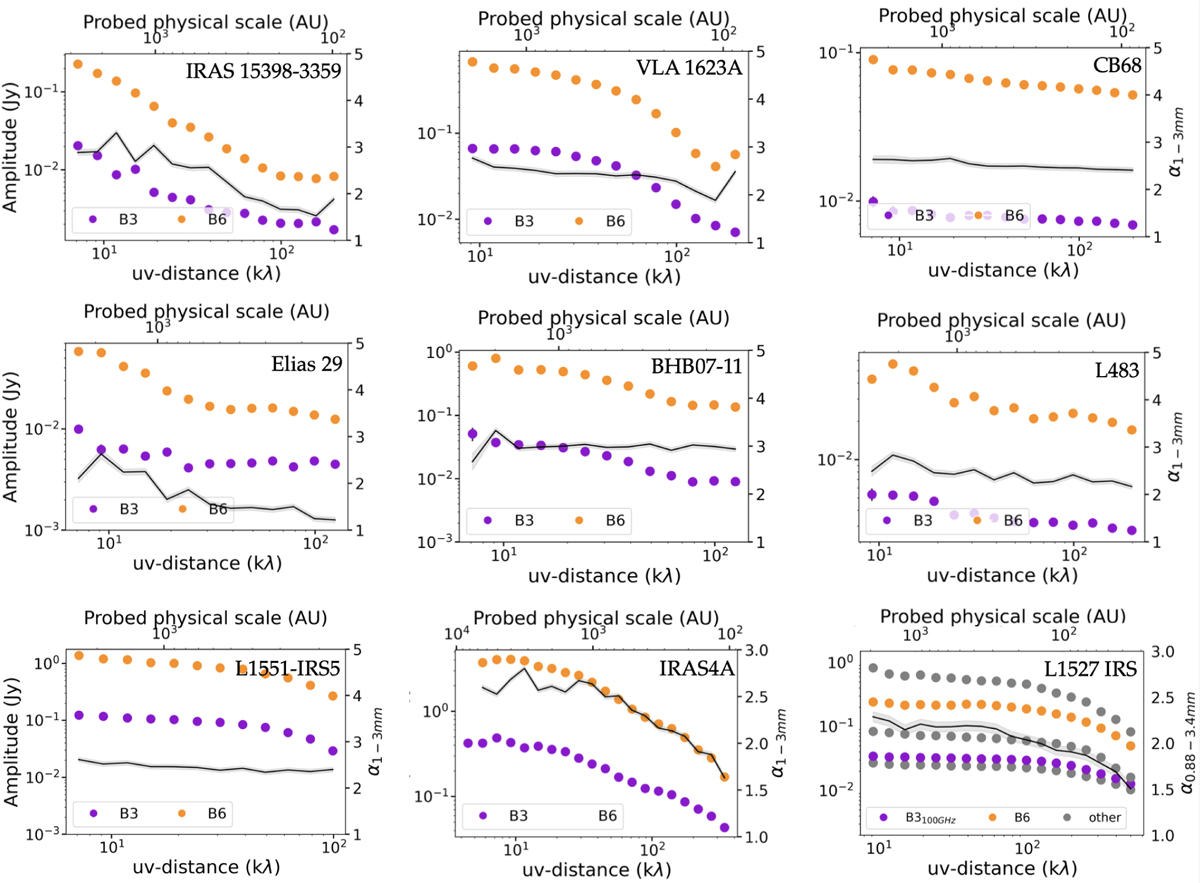
Binned azimuthally averaged amplitude profiles in orange (B6) and violet (B3) for each source are shown on the left y-axis of each panel. The total emission spectral index (black line) of the emission as a function of uv-distance (bottom) or, equivalently, the probed physical scale θ =1.22 λ/uv-distance (top), are shown on the right y-axis of each panel. L1527 IRS was taken from Cacciapuoti et al. (2023), where only 1.2 and 3.1 mm wavelengths (similar to FAUST) were colored according to the other sources, while the other frequencies were plotted in grey.
Current usage metrics show cumulative count of Article Views (full-text article views including HTML views, PDF and ePub downloads, according to the available data) and Abstracts Views on Vision4Press platform.
Data correspond to usage on the plateform after 2015. The current usage metrics is available 48-96 hours after online publication and is updated daily on week days.
Initial download of the metrics may take a while.