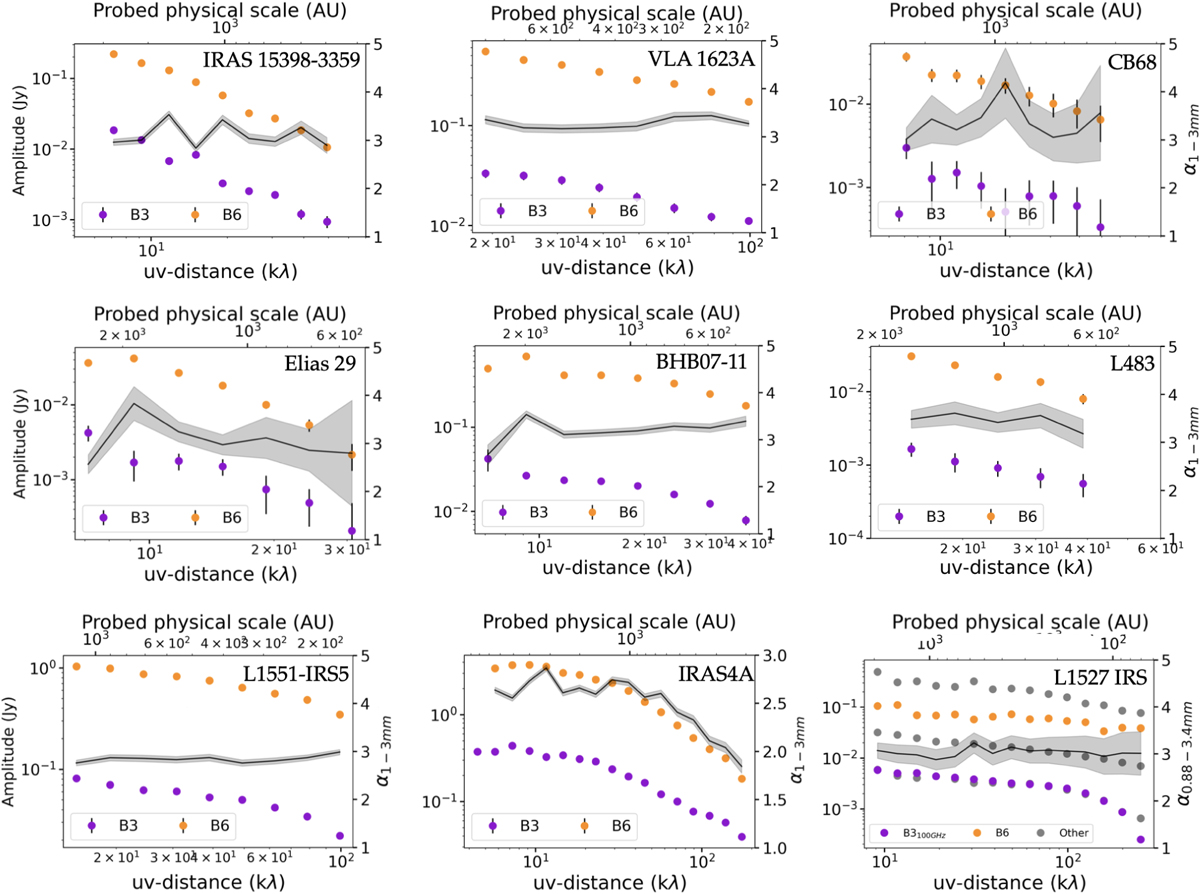
Fig. 4
Download original image
The binned azimuthally averaged amplitude profiles after subtraction of the model compact component, hence of the envelope flux alone, in orange (B6) and violet (B3) for each source refer to the left y-axis of each panel. The envelope spectral index (black line) as a function of uv-distance (bottom) or, equivalently, probed physical scale θ =1.22 λ/uv-distance (top), refers to the right y-axis of each panel. Note: L1527 IRS is from the multi-wavelength analysis of Cacciapuoti et al. (2023), where only FAUST-like wavelengths have been colored uniformly to the other sources and the other frequencies are in grey.
Current usage metrics show cumulative count of Article Views (full-text article views including HTML views, PDF and ePub downloads, according to the available data) and Abstracts Views on Vision4Press platform.
Data correspond to usage on the plateform after 2015. The current usage metrics is available 48-96 hours after online publication and is updated daily on week days.
Initial download of the metrics may take a while.