Fig. 5
Download original image
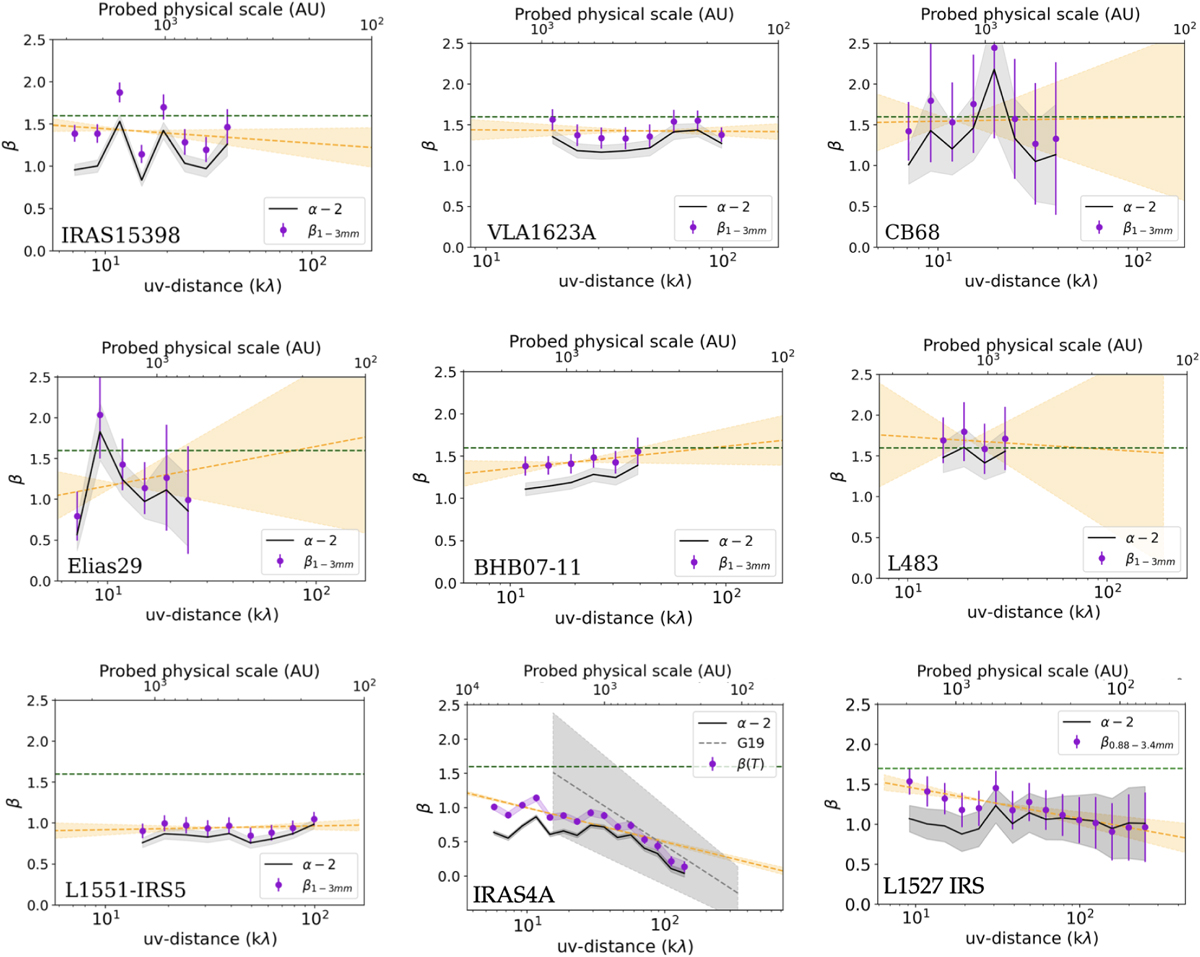
Derived spectral indices of the dust opacity for our sources as a function of uv-distance (bottom) or traced physical scales (top). The black lines represent the β = α−2 approximation, while the purple dots are derived as β = α−d log B(T)/d v in each bin. The orange line is a linear fit to the purple points. The green dashed line is the typical ISM β ∼ 1.6 value. Notes: (i) some sources display more bins than others due to differences in the signal-to-noise ratio of the detection; (ii) for IRAS4A we also report the measured β profile of Galametz et al. (2019) (dashed grey line and 1σ shaded region), limited within the scales that their data probed; and (iii) the profile for L1527 IRS is from Cacciapuoti et al. (2023).
Current usage metrics show cumulative count of Article Views (full-text article views including HTML views, PDF and ePub downloads, according to the available data) and Abstracts Views on Vision4Press platform.
Data correspond to usage on the plateform after 2015. The current usage metrics is available 48-96 hours after online publication and is updated daily on week days.
Initial download of the metrics may take a while.