Fig. 7
Download original image
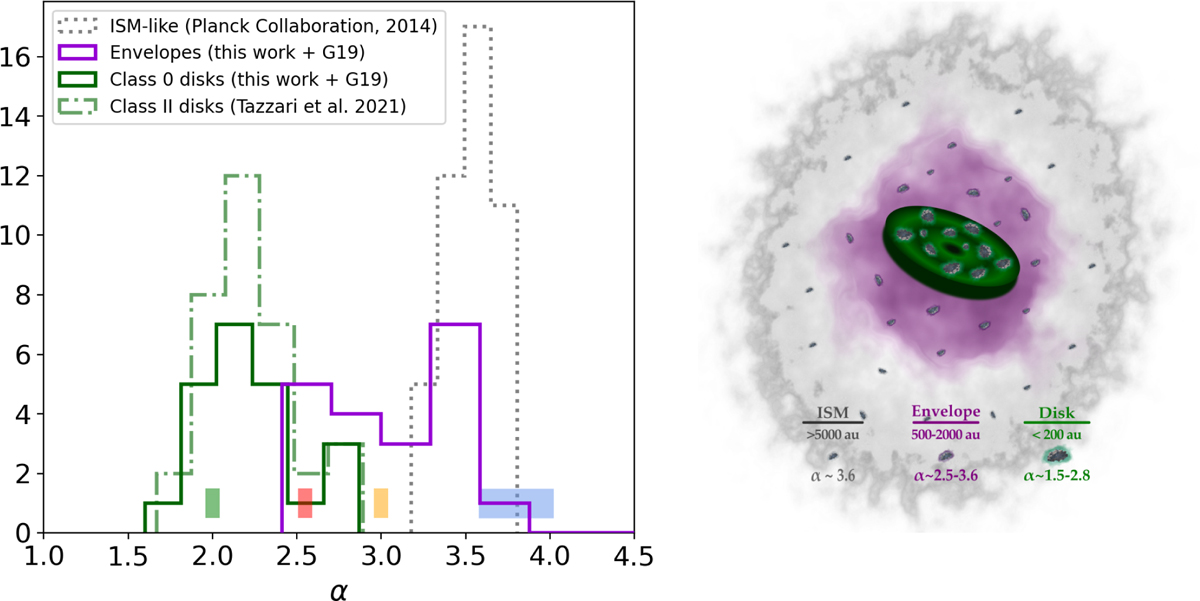
Spectral index distributions ordered following the spatial and time evolution of dust in star- and planet-forming environments. (i) α in the submillimetre (< 350 GHz) for the diffuse ISM (grey dotted representative distribution from Planck Collaboration Int. XIV 2014); (ii) at 1–3.1 mm for the protostellar envelopes at 500 au scales from this work and G19 combined (violet); (iii) at 1–3.1 mm for the class 0 protoplanetary disks from this work and G19 combined (green); (iv) for typical class II disks at 1–3.1 mm (green dash-dotted line, Tazzari et al. 2021). We also show the spectral indices reported by Bracco et al. (2017) for prestellar cores (blue box), class 0 YSOs (red/orange boxes), and a T Tauri disk (green box), all within a common filament in Taurus. The spectral indices of protostellar envelopes appear to be bridging the gap between ISM and disks, hints to a continuous evolution of dust properties from one to the other. On the right, a sketch represents the evolution of dust that emerges from the spectral indices variations, with growth from the (sub-)micron grains in the ISM to the mm/cm-sized grains of disks, through infalling envelopes. The typical scales and values are the ones of the aforementioned studies.
Current usage metrics show cumulative count of Article Views (full-text article views including HTML views, PDF and ePub downloads, according to the available data) and Abstracts Views on Vision4Press platform.
Data correspond to usage on the plateform after 2015. The current usage metrics is available 48-96 hours after online publication and is updated daily on week days.
Initial download of the metrics may take a while.