Fig. 8
Download original image
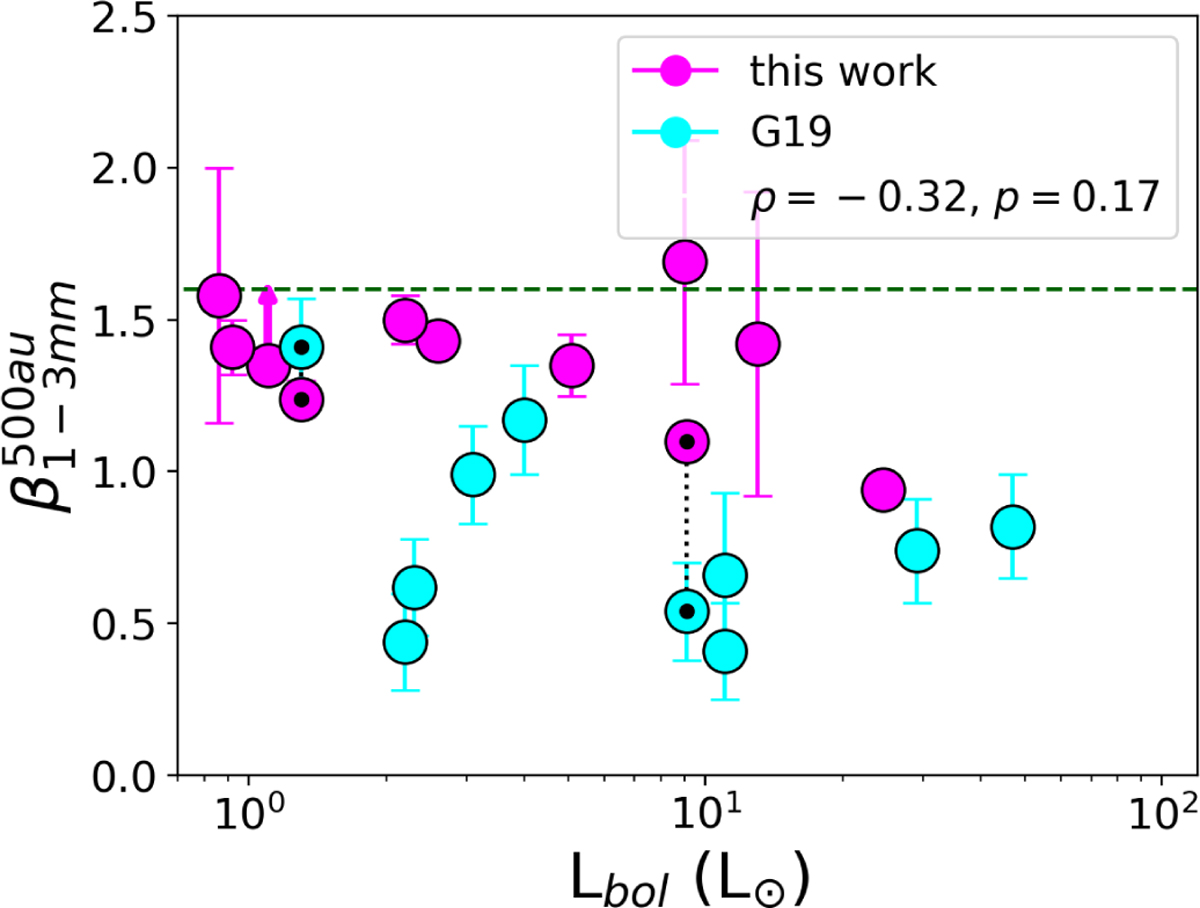
Value of the spectral index of the dust opacity β at 500 au scales from Table 4 as a function of bolometric luminosity of the sources. A black dotted line connects the measured values for IRAS4A and L1527 IRS as measured by G19 and in this work, overlapping within the FAUST and CALYPSO samples (indicated by points with a black central dot). A green dashed line represents typical ISM-like values. For IRAS4C a lower limit is symbolised with an upward arrow. The Pearson correlation coefficient ρ and associated p-value are reported in the upper box.
Current usage metrics show cumulative count of Article Views (full-text article views including HTML views, PDF and ePub downloads, according to the available data) and Abstracts Views on Vision4Press platform.
Data correspond to usage on the plateform after 2015. The current usage metrics is available 48-96 hours after online publication and is updated daily on week days.
Initial download of the metrics may take a while.