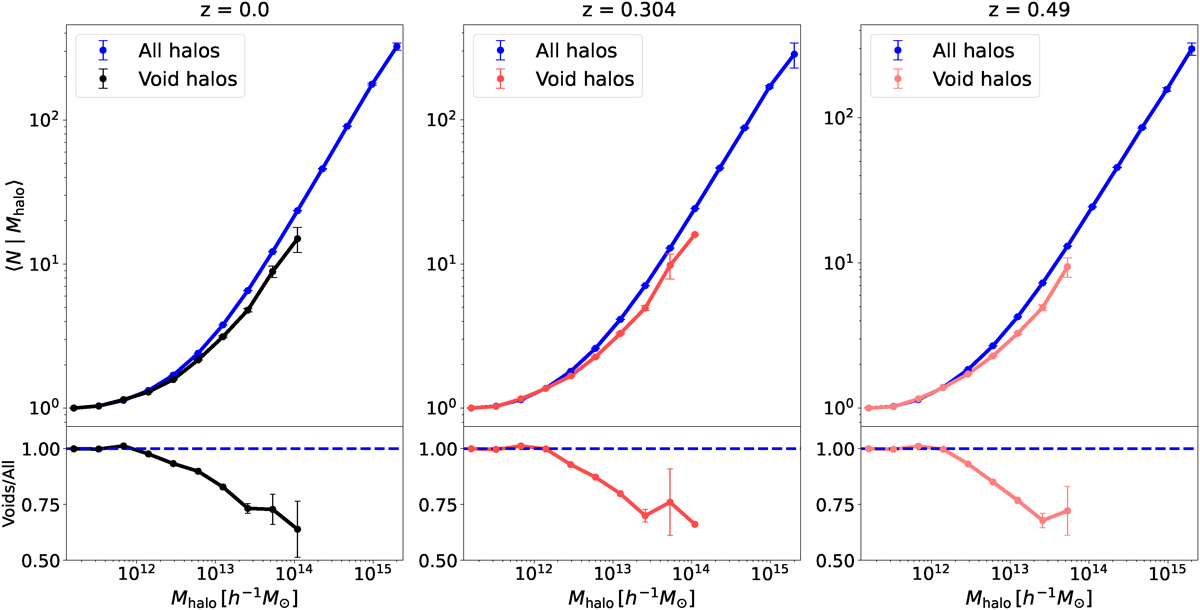
Fig. 2.
Download original image
Top panels: HOD measured for galaxies with Mr − 5log10(h) < − 17 at redshifts z = 0, z = 0.3, and z = 0.5 for the MDPL2-SAG simulation. The blue lines represents the HOD of the complete catalogs, while the black and red lines show the HOD of halos inside the cosmic voids identified in each snapshot. Bottom panels: Ratio of the HOD inside voids to the HOD in the complete catalogs at each redshift. The error bars were estimated via the Jackknife resampling method and using 50 subsamples.
Current usage metrics show cumulative count of Article Views (full-text article views including HTML views, PDF and ePub downloads, according to the available data) and Abstracts Views on Vision4Press platform.
Data correspond to usage on the plateform after 2015. The current usage metrics is available 48-96 hours after online publication and is updated daily on week days.
Initial download of the metrics may take a while.